Vancouver Luxury Real Estate Market Report — April 2026
The Number That Should Have Every Vancouver Luxury Condo Seller's Attention
If you own a luxury condo or townhome in Vancouver and you’re thinking about selling, one number from the April 2026 Institute for Luxury Home Marketing (ILHM) report deserves your full attention. The median days on market for attached luxury homes, condos and townhomes priced above $1,400,000 jumped from 15 days in April 2025 to 25 days in April 2026. That is a 67% increase year over year.
To put that in practical terms: a property that would have had a signed contract in two weeks a year ago is now sitting on the market for nearly four weeks before selling. In luxury real estate, time on market is not a neutral statistic. Every additional week a luxury property sits unsold raises questions in buyers’ minds, creates negotiating leverage for offers, and costs the seller carrying costs they hadn’t planned for.
This doesn’t mean , and sellers who price and present their property as though it’s still April 2025 are going to feel that gap.
The Full Picture — Vancouver Luxury Market April 2026


The ILHM report covers two segments of the Vancouver luxury market separately — single-family homes and attached homes. Here is what the data shows across both.
Vancouver Luxury Single-Family Homes
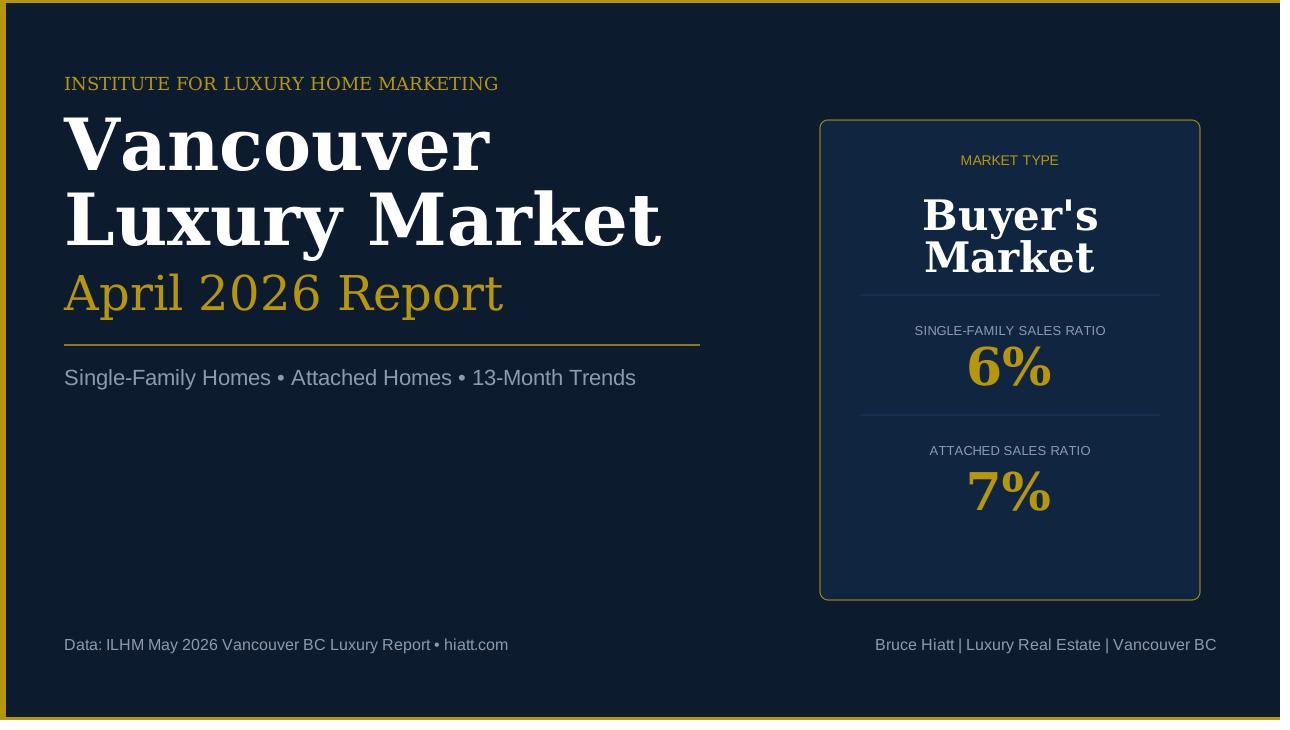
The luxury benchmark for single-family homes is $2,500,000. In April 2026, there were 1,241 active listings and 69 sales, producing a sales ratio of 6%; firmly in Buyer’s Market territory. For context, a Buyer’s Market is defined as a sales ratio below 12%.
The median luxury single-family sales price in April 2026 was $3,350,000, down 3% from $3,450,000 in April 2025. Homes are selling at a median of 94.25% of list price; down from 95.52% a year ago. On a $3,500,000 listing that represents approximately $210,000 below asking as a realistic transaction expectation.
Days on market held steady at 27 days year over year and it’s the one metric that showed no deterioration in this segment. The most active price band for single-family homes is $3,100,000 to $3,299,999, where the sales ratio reaches 12%. That’s the threshold between a Buyer’s Market and a Balanced Market. If you’re pricing a single-family home, this band represents the strongest buyer demand in the current market.
Sale price per square foot came in at $943, down 7% from $1,012 in April 2025. For sellers and their advisors who use price per square foot as a listing benchmark, this adjustment is meaningful and should be reflected in current pricing strategy.
Vancouver Luxury Attached Homes
The luxury benchmark for attached homes, condos and townhomes; is $1,400,000. In April 2026 there were 1,181 active listings and 81 sales, producing a sales ratio of 7% which is also a Buyer’s Market. The median luxury attached sales price was $1,650,000, down 3% from $1,700,000 in April 2025. Attached homes are selling at 97.10% of list price, notably closer to asking than single-family homes, which reflects stronger relative demand in the entry-level luxury condo segment.
The most active price band in the attached segment is a notable outlier. It’s $7,700,000 to $8,999,999 which carries a 33% sales ratio, indicating a Seller’s Market. Ultra-premium attached product in this range is moving with genuine urgency while the broader attached market sits in Buyer’s Market conditions. This divergence is worth understanding if you’re buying or selling in the upper end of the condo market.
What the 13-Month Trend Tells Us
The ILHM report tracks 13 months of data which provides important context beyond the single month snapshot.
For single-family homes the median sales price has ranged between $3,185,000 and $3,494,900 over the past 13 months. That’s a relatively narrow band that suggests price stability despite softening sales volumes. Inventory peaked at 1,574 in May 2025 and has been declining since, reaching 1,241 in April 2026. Sales volumes have also declined from a high of 122 in August 2025 to 69 in April 2026. Falling inventory alongside falling sales is not a distressed market as it reflects reduced participation from both sides rather than a one-sided collapse.
For attached homes the median sales price has been remarkably stable, ranging between $1,650,000 and $1,836,500 over 13 months. The sharp rise in days on market from 15 to 25 is the clearest signal of changing conditions and is the trend worth watching most closely in the months ahead.
What This Means If You're Buying
April 2026 is a genuinely good time to be a luxury buyer in Vancouver. Both market segments are firmly in Buyer’s Market territory. Inventory in both categories, over 1,200 single-family homes and over 1,180 attached properties priced at the luxury threshold, gives you genuine choice. Sellers are negotiating, with single-family homes closing at 94.25% of list price on average. Days on market give you time to be deliberate rather than reactive.
The risk in a Buyer’s Market is complacency, assuming the window stays open indefinitely. Inventory is actually declining year over year in both segments, and if buyer demand returns the shift from Buyer’s to Balanced Market can happen faster than most people expect. Buyers who are ready to move when the right property appears are better positioned than those waiting for a market bottom that may not arrive cleanly.
What This Means If You're Selling
Pricing accurately and presenting exceptionally are not optional in this market as they are the entire strategy. With 1,241 single-family listings competing for 69 buyers and 1,181 attached listings competing for 81 buyers, properties that are overpriced or under-presented simply don’t sell. They accumulate days on market, attract lower offers, and ultimately sell for less than a correctly priced property would have achieved on day one.
The sellers doing well in April 2026 are those who understand where the active demand actually sits. That’s the $3,100,000 to $3,299,999 band for single-family, and the entry-level luxury condo segment for attached for price and market accordingly.
A Note on the Data
Disclaimer: The figures in this post are drawn directly from the Institute for Luxury Home Marketing’s May 2026 Vancouver British Columbia Luxury Market Report, covering April 2026 sales and inventory data. The ILHM sets the luxury benchmark prices and sales ratio thresholds used throughout this analysis. As an Elite member of the Institute for Luxury Home Marketing, I receive this report monthly and publish a market analysis based on its findings each month. Market data reflects conditions as reported for April 2026. Individual neighbourhood and property type results vary from market-wide medians.
Let's Talk About Your Position in This Market
Whether you’re weighing a sale, evaluating a purchase, or simply trying to understand what the data means for a property you already own, I’m happy to have that conversation. The numbers in a market report tell the broad story, the neighbourhood-level detail, the specific building dynamics, and the current buyer activity in your price range are the conversation that follows.
Contact Bruce Hiatt directly and I personally respond to every inquiry.
Data source: Institute for Luxury Home Marketing, May 2026 Vancouver British Columbia Luxury Market Report. Market data covers April 2026.
