Vancouver Luxury Attached Market: September 2026 Data
Vancouver's luxury condo market just shifted back to buyers.
Vancouver's luxury attached market, condos and townhomes priced from $1,400,000, moved back into Buyer's Market territory in September 2026 with a 10 percent sales ratio. After three straight months in the Balanced range from June through August, the segment recorded 113 sales against 1,123 active listings, down from 126 sales in August while inventory rose from 1,054. It was the slowest month for sales since April.
The median sales price came in at $1,688,000, down $96,000 from August, and homes sold at a median of 96.88 percent of list price. Median days on market rose to 28, from 21 a year earlier. Beneath those totals, the entry level of the luxury range held up well, and that is where the market divided this month.
Where Activity Concentrates: Under $1.7 Million
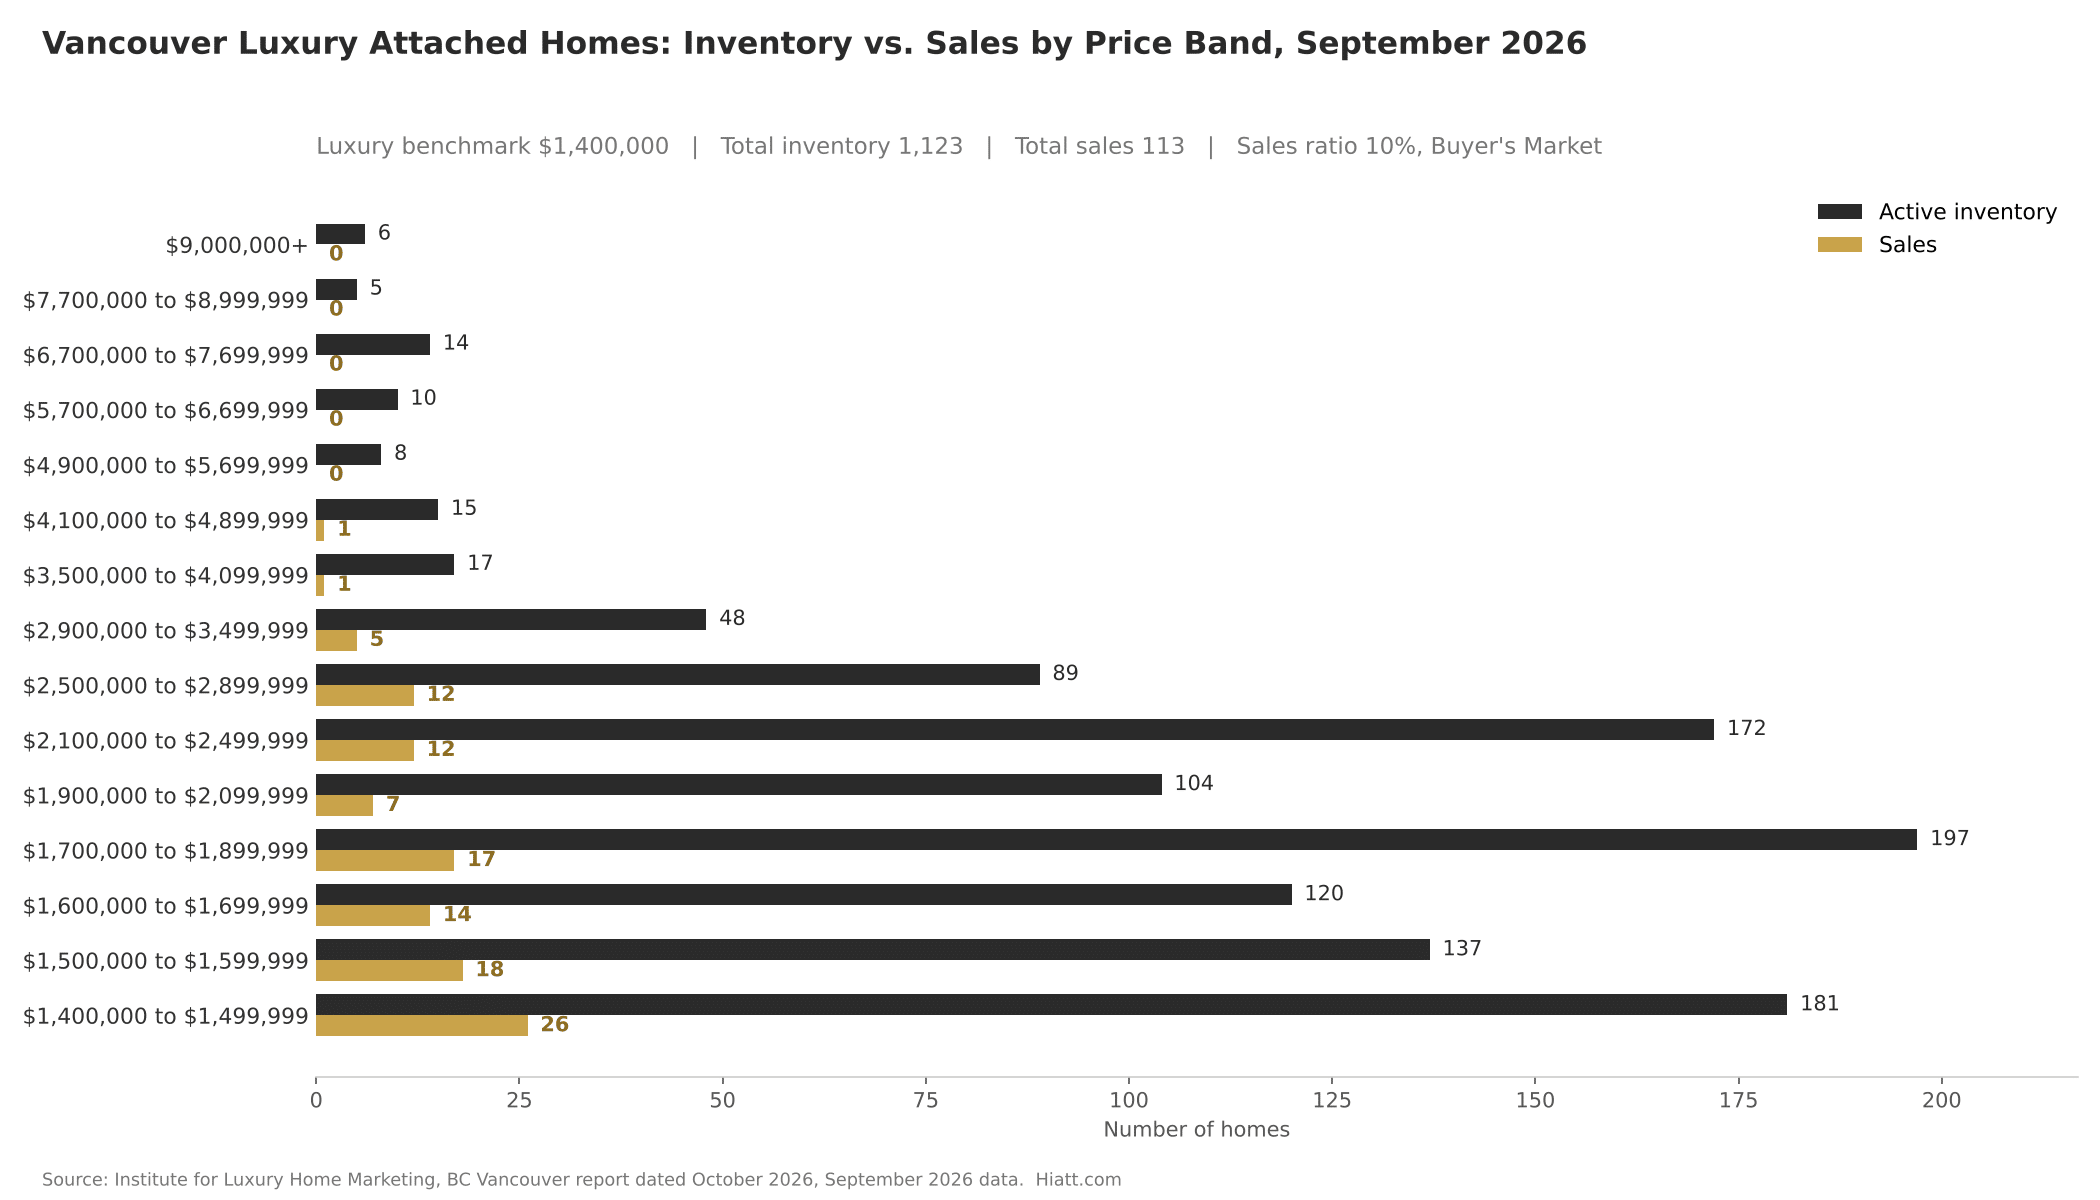
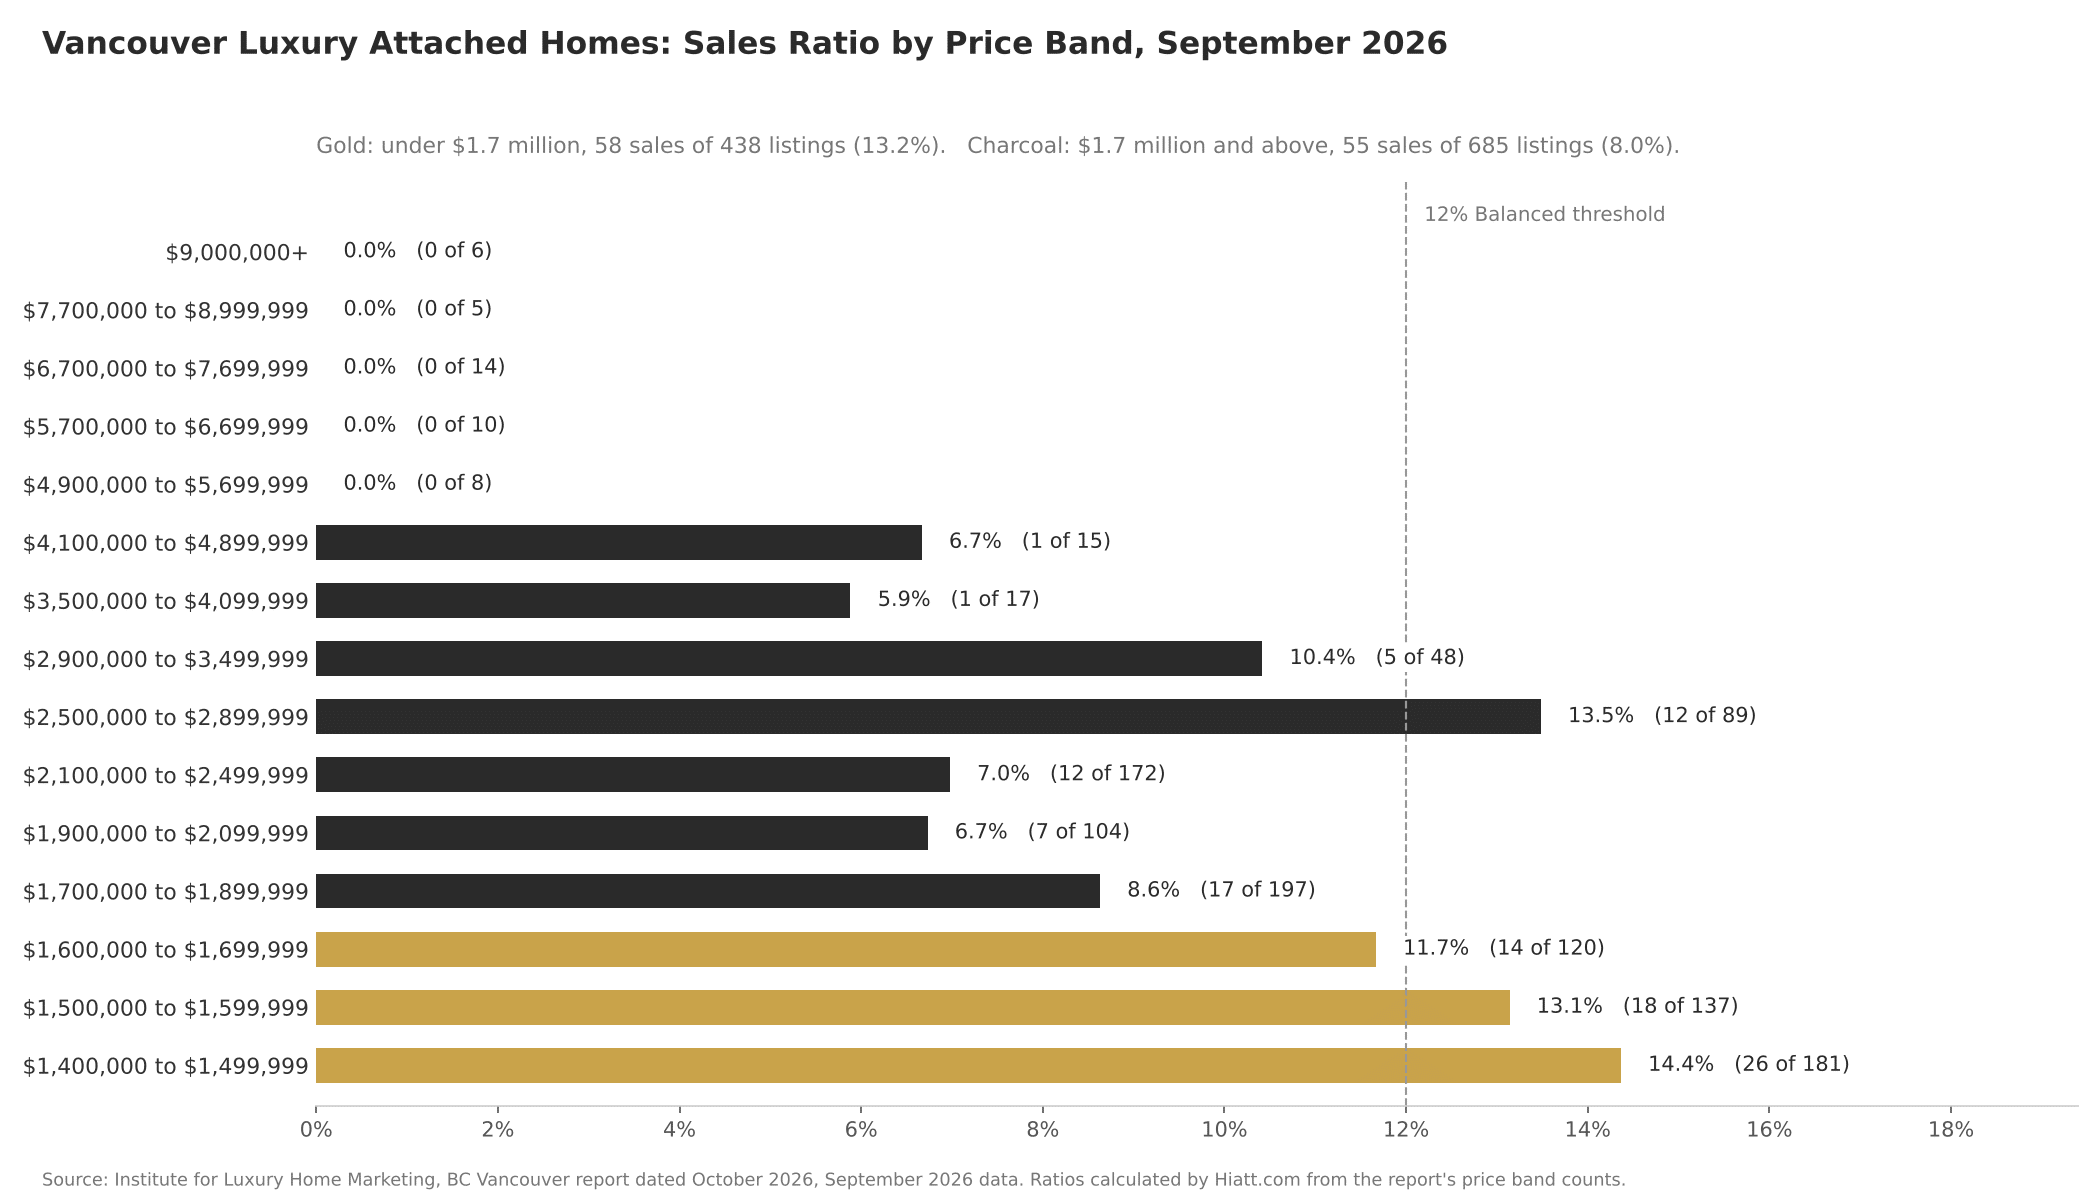
Condos and townhomes priced from $1,400,000 to $1,699,999 made up 438 of the month's 1,123 listings and 58 of its 113 sales, a combined sales ratio of 13.2 percent, inside the Balanced range. Each of the three price bands in this tier was at or near that level: 14.4 percent from $1.4 million to $1.5 million, 13.1 percent from $1.5 million to $1.6 million, and 11.7 percent from $1.6 million to $1.7 million.
The $1,400,000 to $1,499,999 price band was the most active on the report, with 26 sales from 181 listings. In other words, more than half of September's attached sales happened in the first $300,000 of the luxury range.
$1.7 Million and Above: Slower, With One Exception
From $1.7 million up, 685 condos and townhomes were listed and 55 sold, a sales ratio of 8.0 percent. The largest stretch was $1.7 million to $2.5 million, where 473 listings produced 36 sales, about 7.6 percent. That range includes the largest price band on the report, $1,700,000 to $1,899,999, with 197 listings, and $2,100,000 to $2,499,999, with 172.
The exception was the $2,500,000 to $2,899,999 price band, where 12 of 89 listings sold, 13.5 percent, and the band above it, $2,900,000 to $3,499,999, which sold 5 of 48. Taken together, $2.5 million to $3.5 million sold at 12.4 percent, a sign that buyers remained active at that level even as the range below it slowed. Above $3.5 million, 75 listings produced 2 sales, and nothing above $4.9 million sold in September.
Sales Ratio by Square Footage
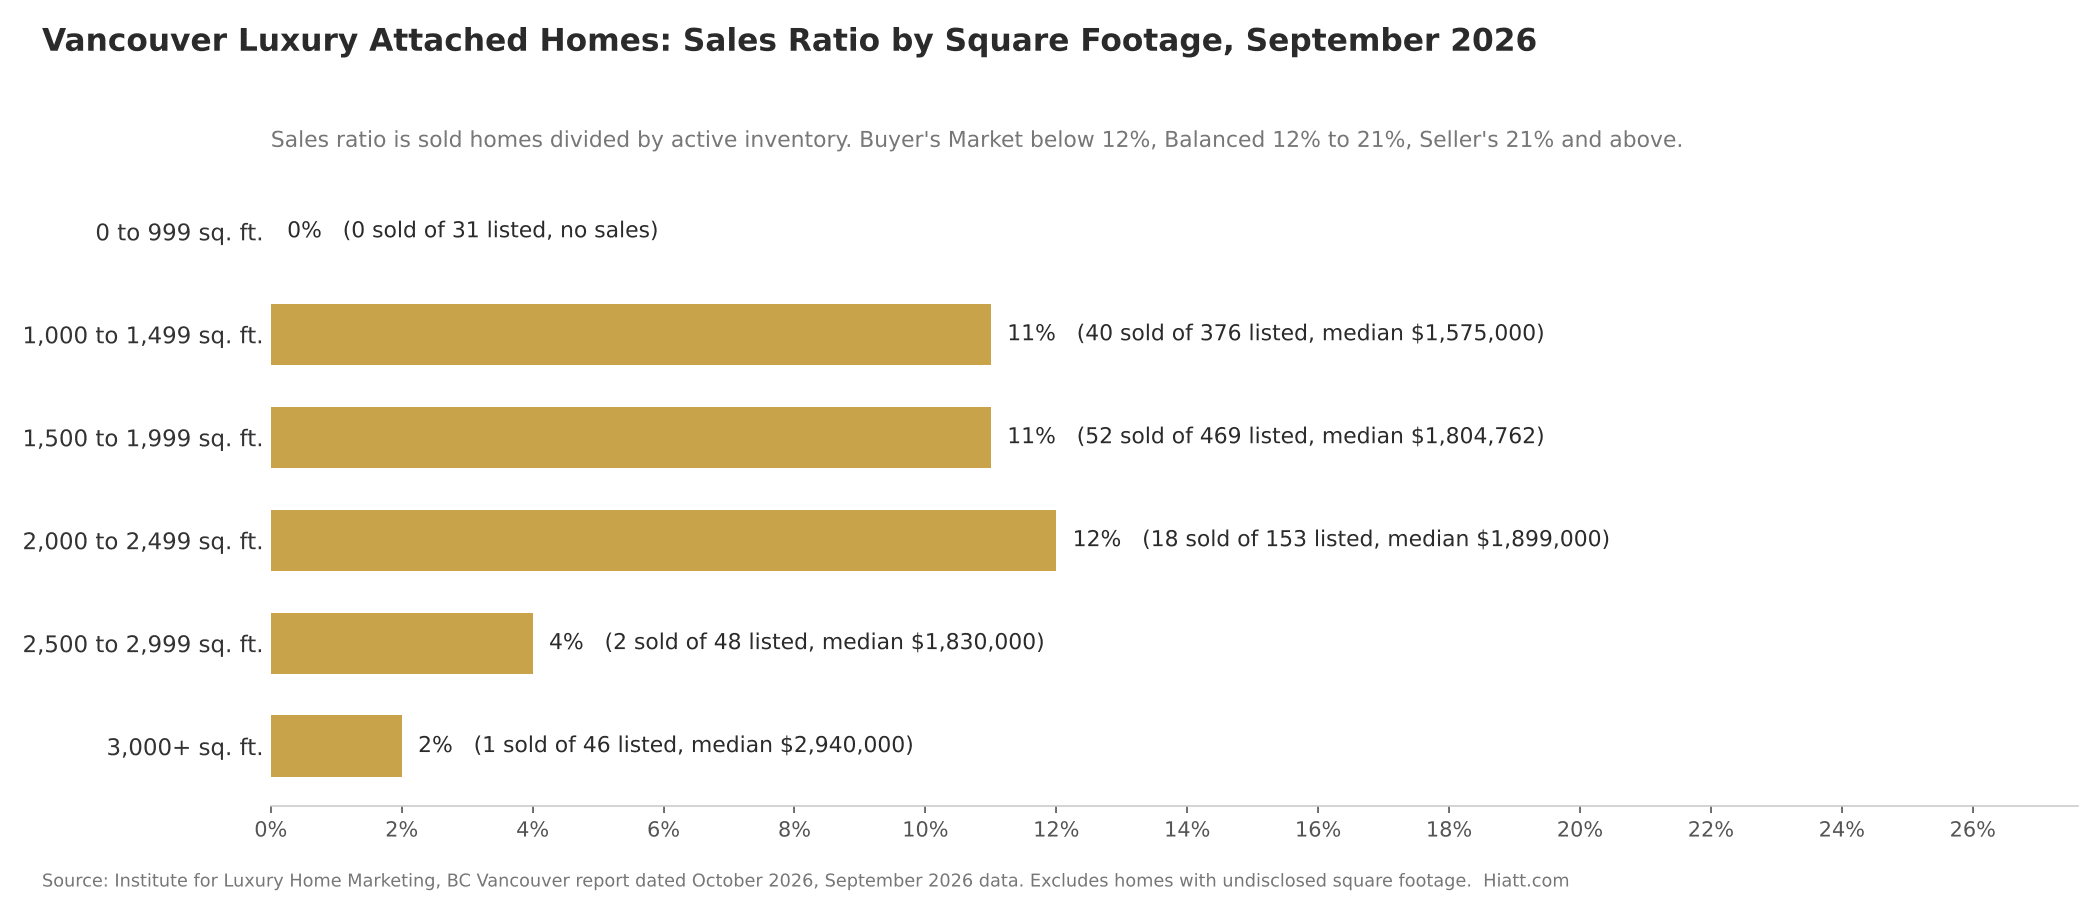
Homes of 1,000 to 1,999 square feet carried the month. The 1,000 to 1,499 and 1,500 to 1,999 square foot ranges each sold at 11 percent, 40 of 376 and 52 of 469 respectively, at medians of $1,575,000 and $1,804,762. The 2,000 to 2,499 square foot range posted the highest ratio, 12 percent, with 18 of 153 selling at a median of $1,899,000.
The largest suites moved slowly. Homes of 2,500 to 2,999 square feet sold 2 of 48 listings, and homes of 3,000 square feet and up sold 1 of 46, at a median of $2,940,000. No home under 1,000 square feet sold, from 31 listings.
13 Month Trend
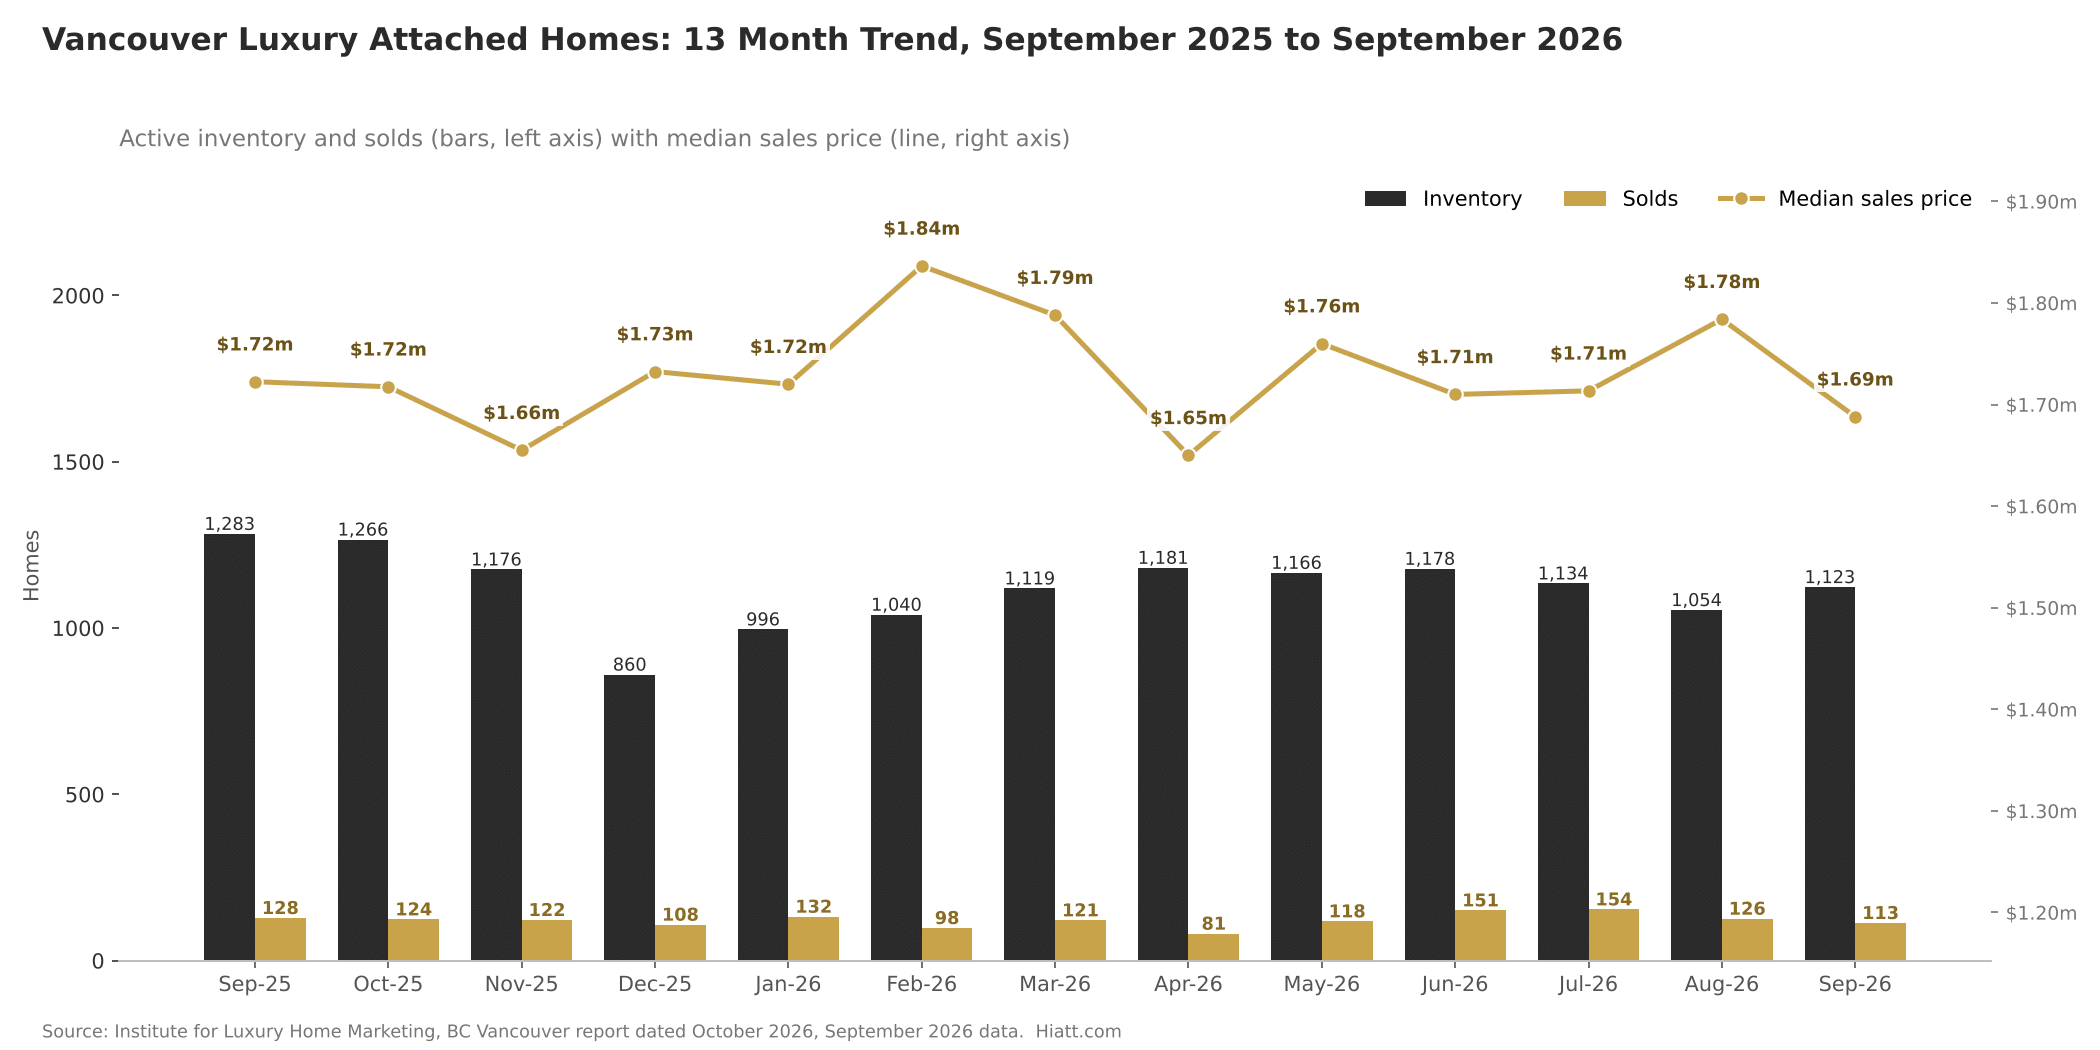
The summer run is clearly cooling. Sales reached 151 in June and 154 in July, the two strongest months in the trailing 13, then eased to 126 in August and 113 in September. Inventory, 1,283 a year ago, dipped to 1,054 in August and has now ticked back up to 1,123.
The median price has moved within a fairly tight range all year, from a low of $1,650,000 in April to a high of $1,836,500 in February. September's $1,688,000 sits toward the lower end of that range, consistent with more of the month's sales happening at the entry level.
Year over Year Comparison
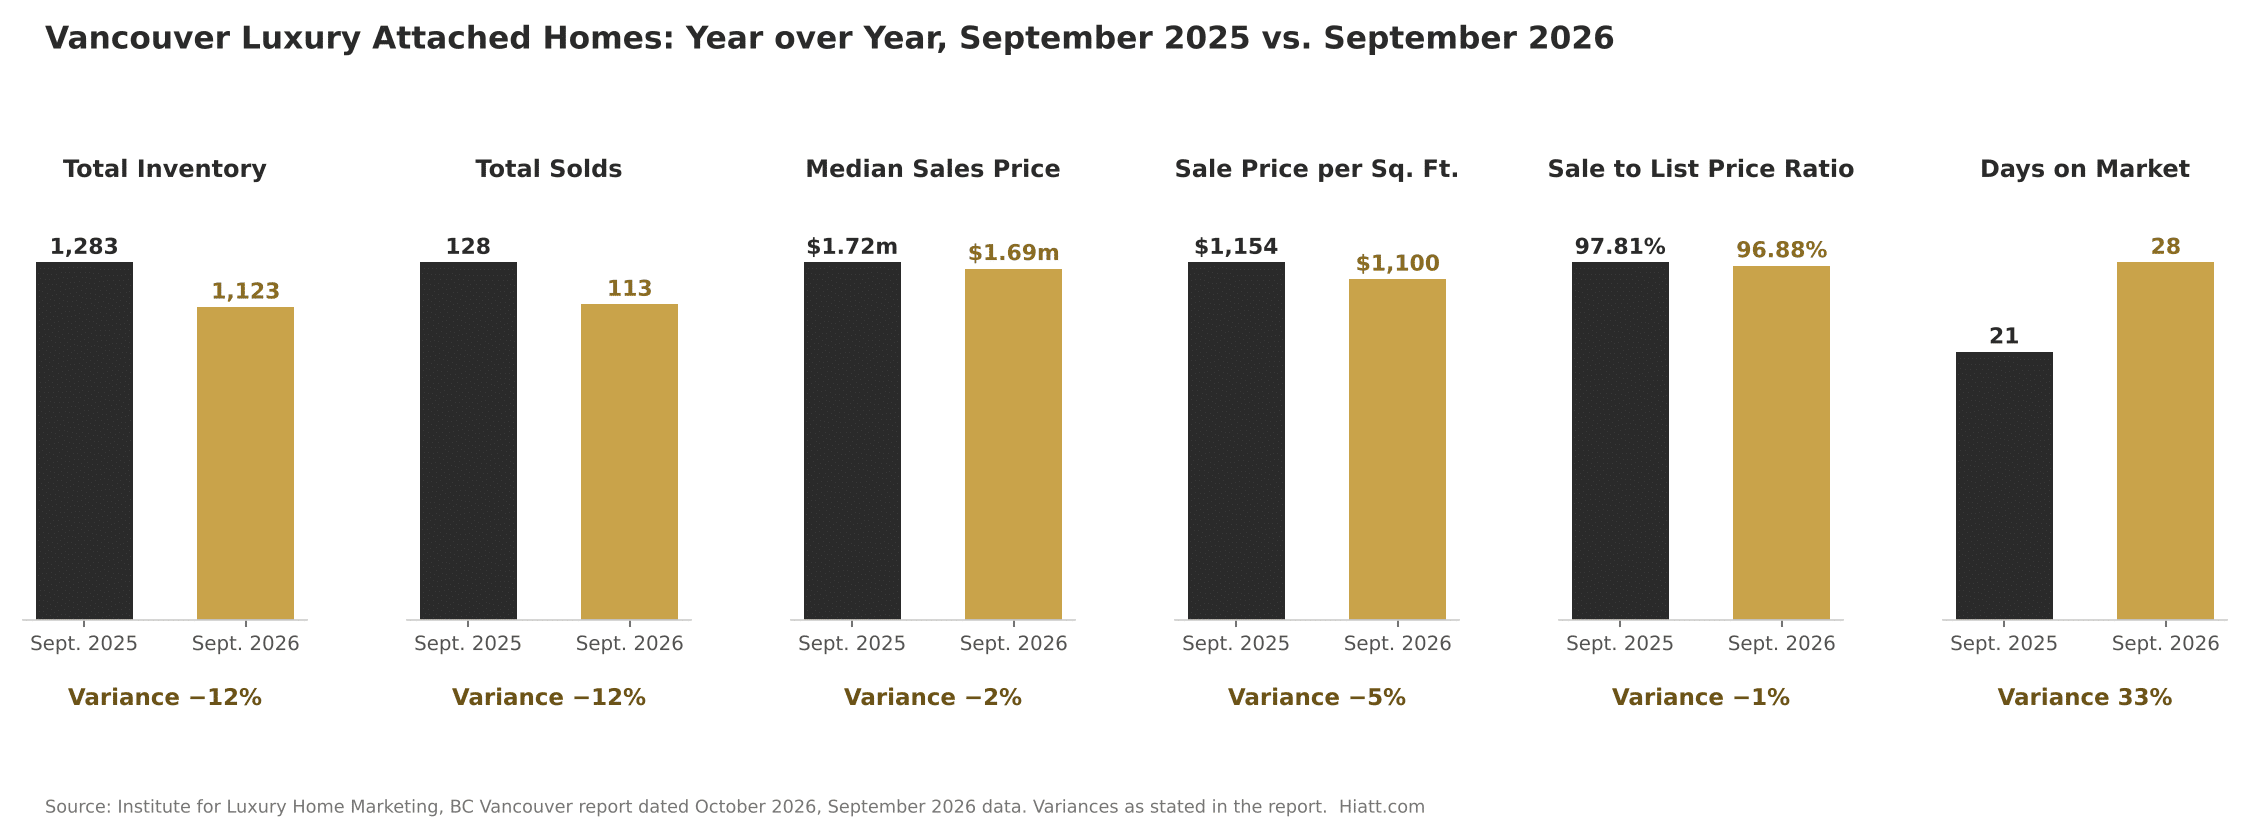
Compared with September 2025, inventory and sales are both down 12 percent, inventory from 1,283 to 1,123 and sales from 128 to 113. The median sales price is down 2 percent, from $1.72 million to $1.69 million, and sale price per square foot is down 5 percent, from $1,154 to $1,100.
Days on market rose 33 percent, from 21 to 28, and the share of list price paid slipped from 97.81 percent to 96.88 percent. Unlike the detached segment, where most measures improved on last year, the attached segment is a little softer than it was twelve months ago, though the change is modest.
What This Means for Buyers
Under $1.7 million, expect competition for the best suites. The entry tier is selling at a Balanced pace, so a well priced condo or townhome with a good layout and a solid strata may draw more than one buyer.
From $1.7 million to $2.5 million, buyers have time and choice, with 473 listings and a sales ratio under 8 percent. Above $3.5 million the selection is smaller but very few homes are trading, which leaves room to negotiate. In both ranges, a conversation with Bruce Hiatt about the specific building, its strata history and recent sales is the most reliable way to judge value.
What This Means for Sellers
Sellers under $1.7 million are in a market that still moves. Pricing in line with recent sales in the building and presenting the home well should be enough to attract serious interest.
Sellers between $1.7 million and $2.5 million face the most competition from other listings and should price accordingly from the first day. Above $3.5 million, plan for a longer marketing period and a buyer who will compare every comparable suite before making an offer.
Request the Full October 2026 (September 2026 Data) ILHM Report
The complete analysis and the ILHM Luxury Market Report for Metro Vancouver is available upon request at hiatt.com.
Bruce Hiatt is a Guild Elite Member of the Institute for Luxury Home Marketing, serving buyers and sellers across Metro Vancouver's luxury detached and attached segments.