Vancouver Luxury Single-Family Market: August 2026 Data
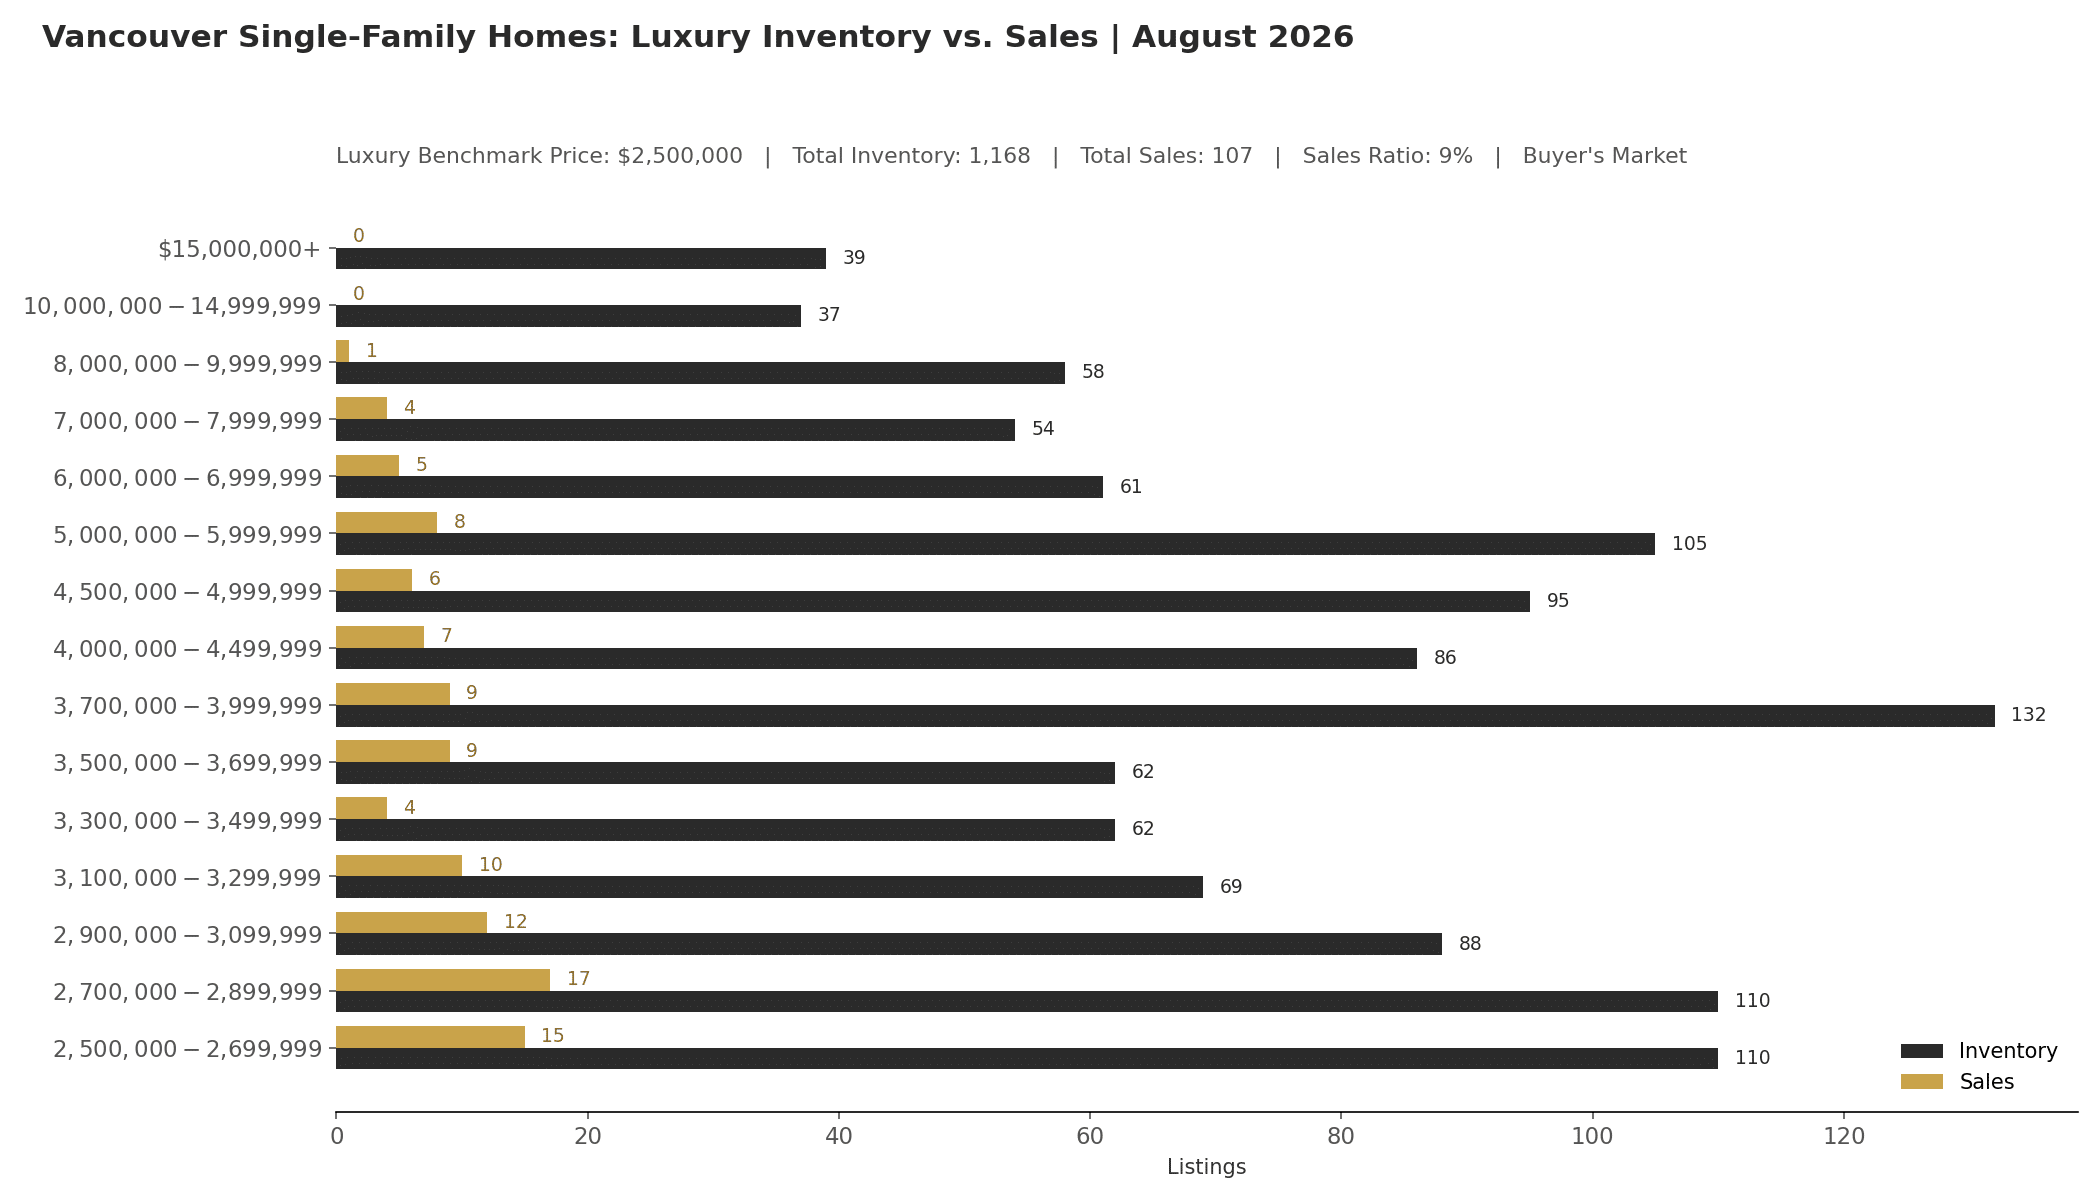
Metro Vancouver's luxury single-family market held in Buyer's Market territory in August 2026, with a 9 percent sales ratio against a $2,500,000 benchmark. Total active inventory stood at 1,168 homes against 107 sales for the month. The median sales price was $3,275,000, homes sold at a median of 95.05 percent of list price, and the median days on market fell to 19, down from 28 a year earlier. The story beneath those headline numbers is a market split cleanly in two, real and sustained activity under roughly $3.7 million, and a much thinner, more negotiable market above it.
Where Activity Concentrates: Under $3.7 Million
Homes priced from $2,500,000 to $3,699,999 account for 501 of the month's 1,168 active listings and 67 of its 107 sales, a combined sales ratio of 13.4 percent, well above the market's overall 9 percent. The most active single band was $2,700,000 to $2,899,999, where 17 of 110 active listings sold, a ratio close to 15 percent. Nearly every band under $3.7 million posted a double digit ratio, a consistent pattern of real, ongoing demand rather than one isolated pocket of activity.
Above $3.7 Million: A Much Thinner Market
From $3.7 million up, the picture changes. This tier holds 667 active listings but only 40 sales, a sales ratio of 6.0 percent, roughly half the rate of the tier below it. The thinning continues the higher the price climbs. In the $8,000,000 and above range, 134 homes were actively listed in August against a single sale, a sales ratio well under 1 percent. Inventory has been building at the top of the market for months without a matching rise in buyer activity.
Sales Ratio by Square Footage
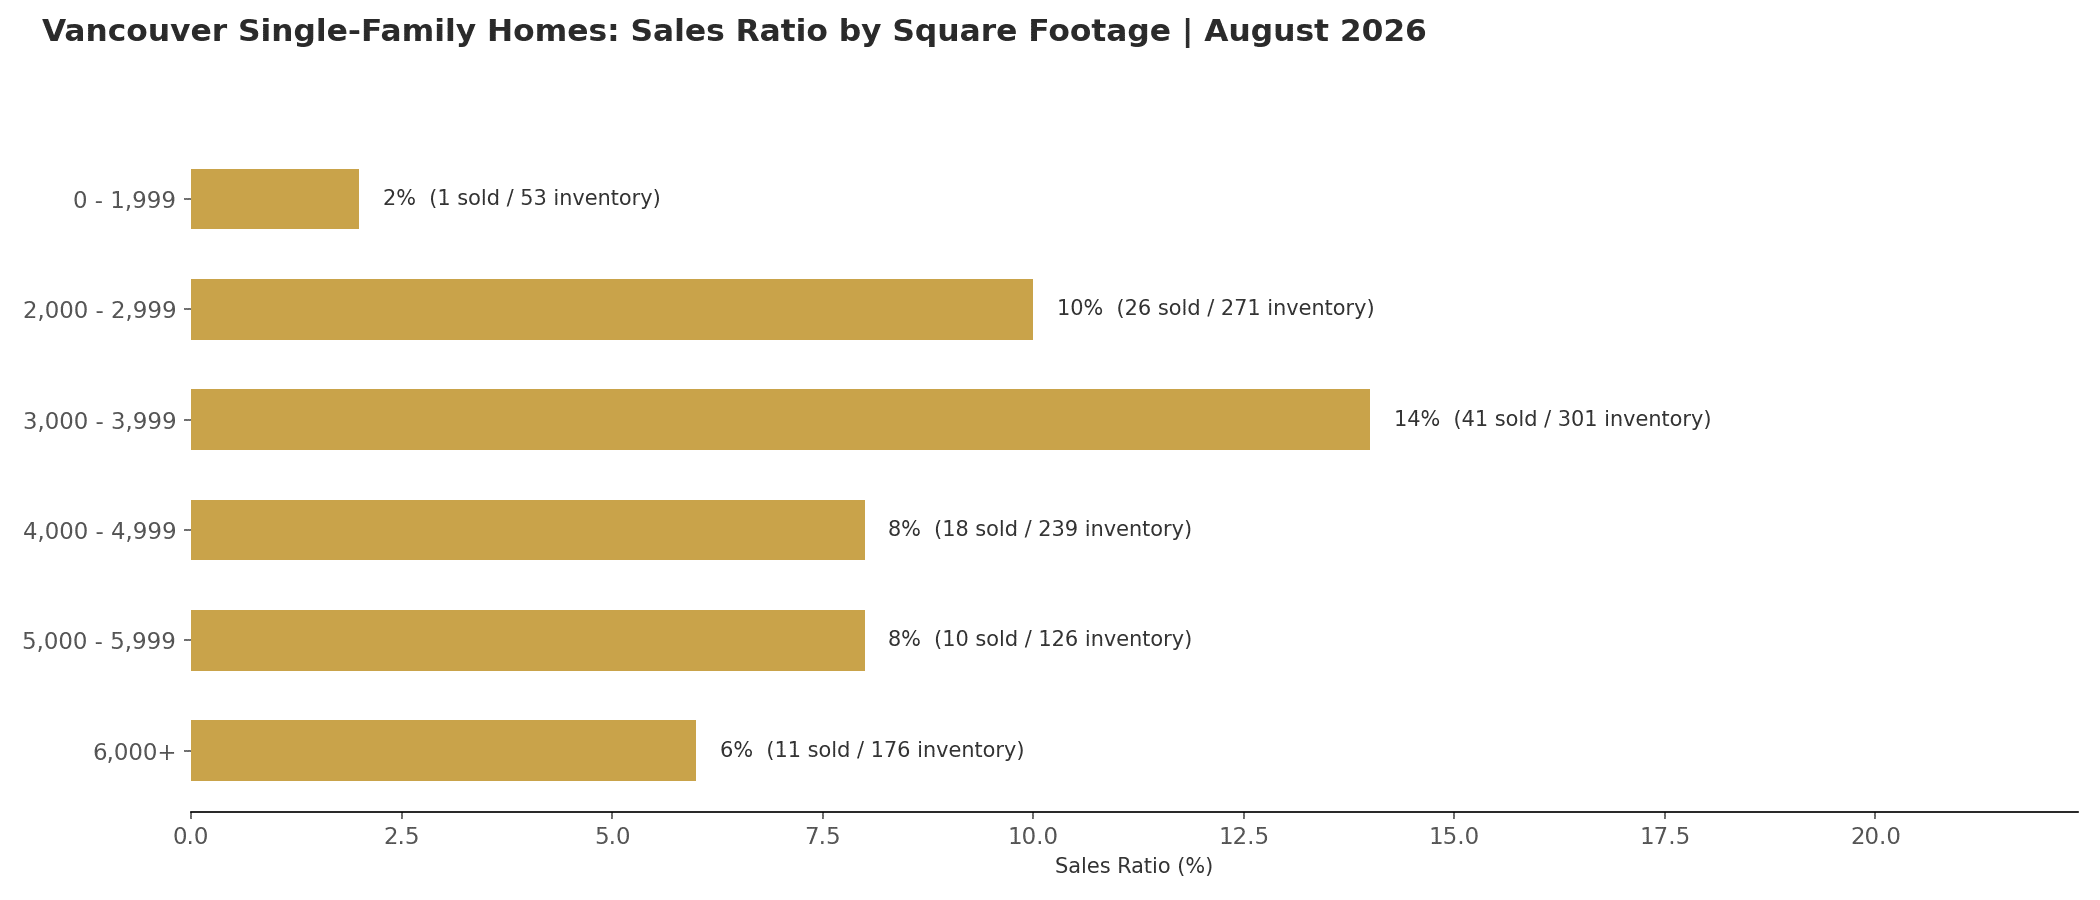
Home size tells a similar story. The 3,000 to 3,999 square foot range was the most liquid this month, with 41 of 301 active listings selling, a 14 percent ratio, at a median price of $3,100,000, squarely inside the tier under $3.7 million. Homes under 2,000 square feet moved the slowest of any size band, just 1 of 53 active listings sold, even though their median price of $2,900,000 sits well within the market's active range, a sign that small lot inventory at this price point is thin and not always what buyers in this segment are shopping for. The largest homes, 6,000 square feet and up, carried the highest median price at $6,350,000 and a 6 percent sales ratio, consistent with the broader slowdown above $3.7 million.
13 Month Trend
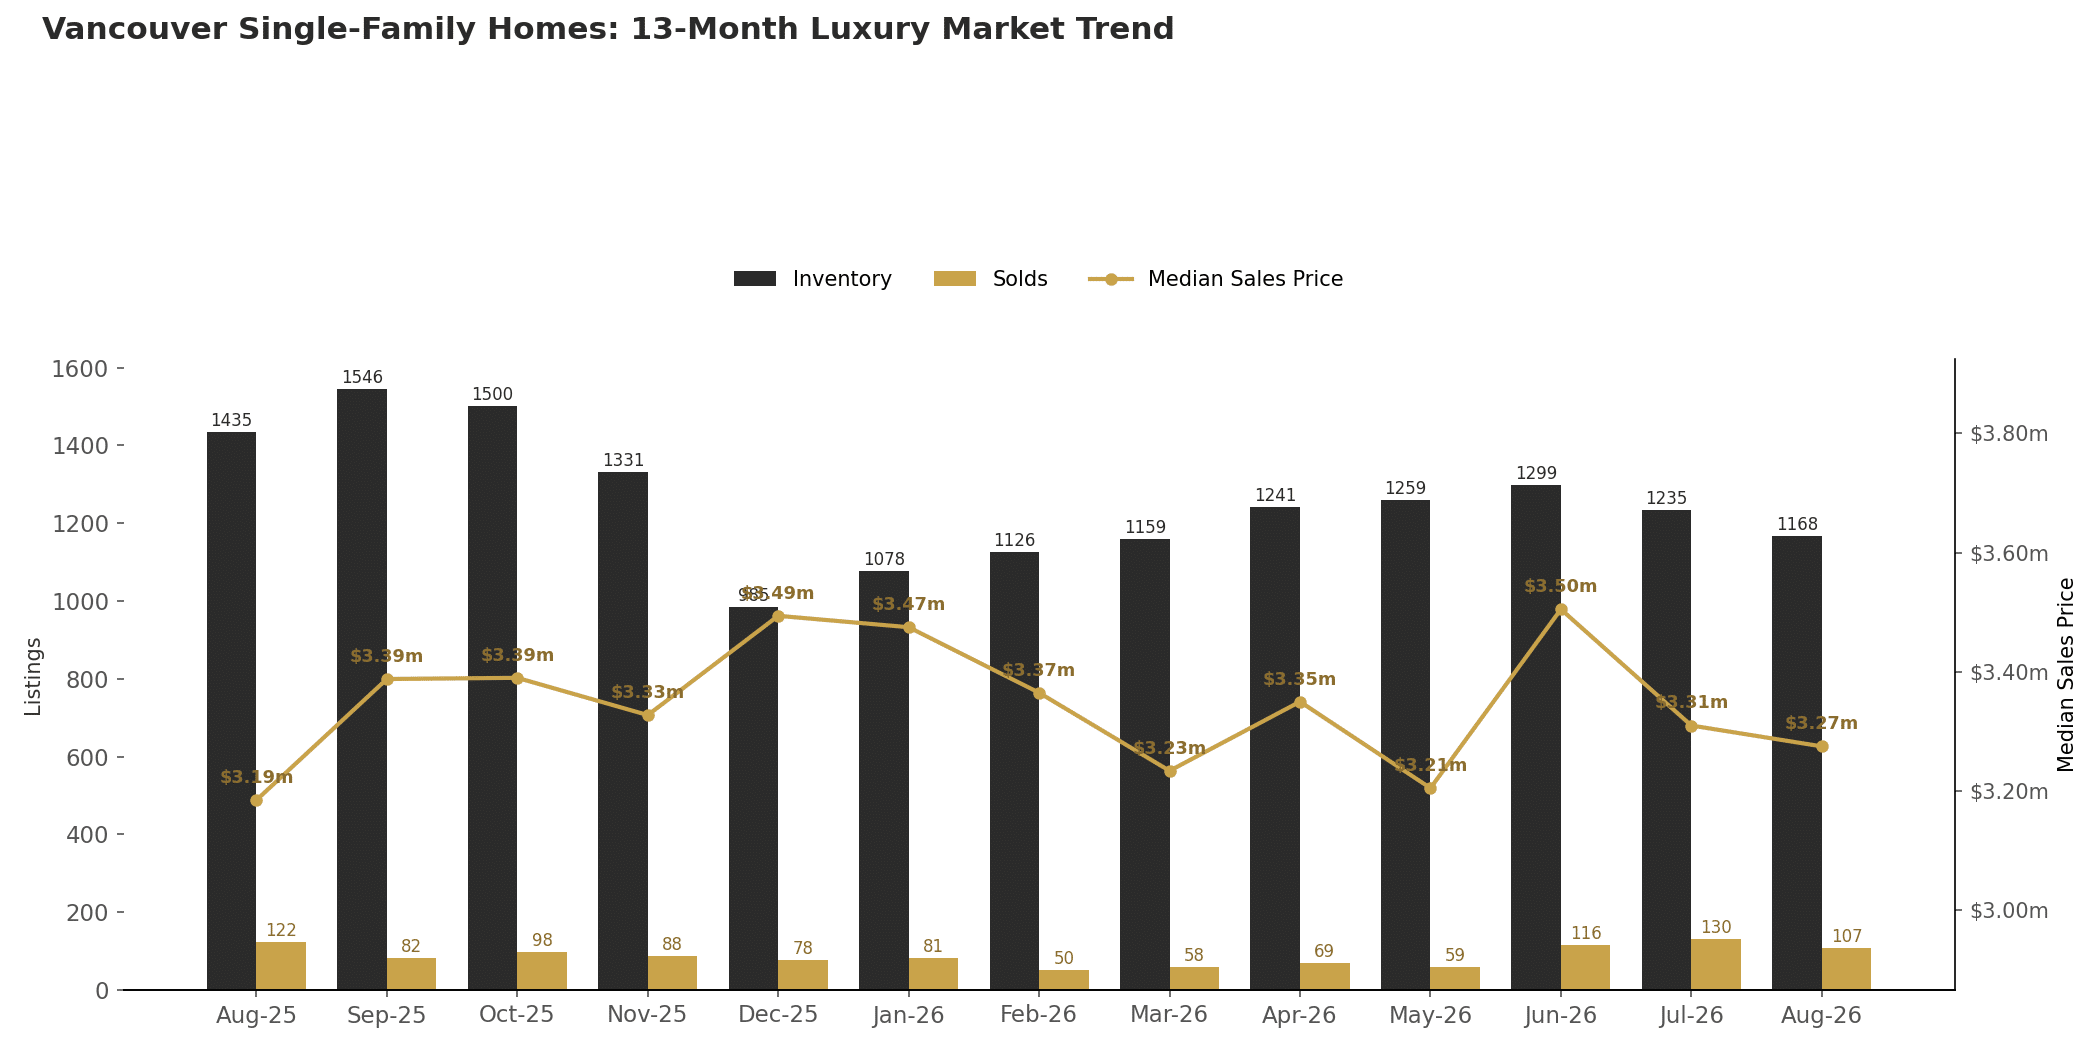
Inventory has been contracting for most of the past year, from 1,546 active listings in September 2025 down to 1,168 in August 2026. Monthly sales spent the winter and spring months in the 50 to 80 range before climbing to 116 in June, 130 in July, and 107 in August, three of the strongest months in the trailing 13. Median price moved in a comparatively narrow band across the same period, mostly between $3.2 million and $3.5 million, without a clear sustained trend in either direction.
Year over Year Comparison
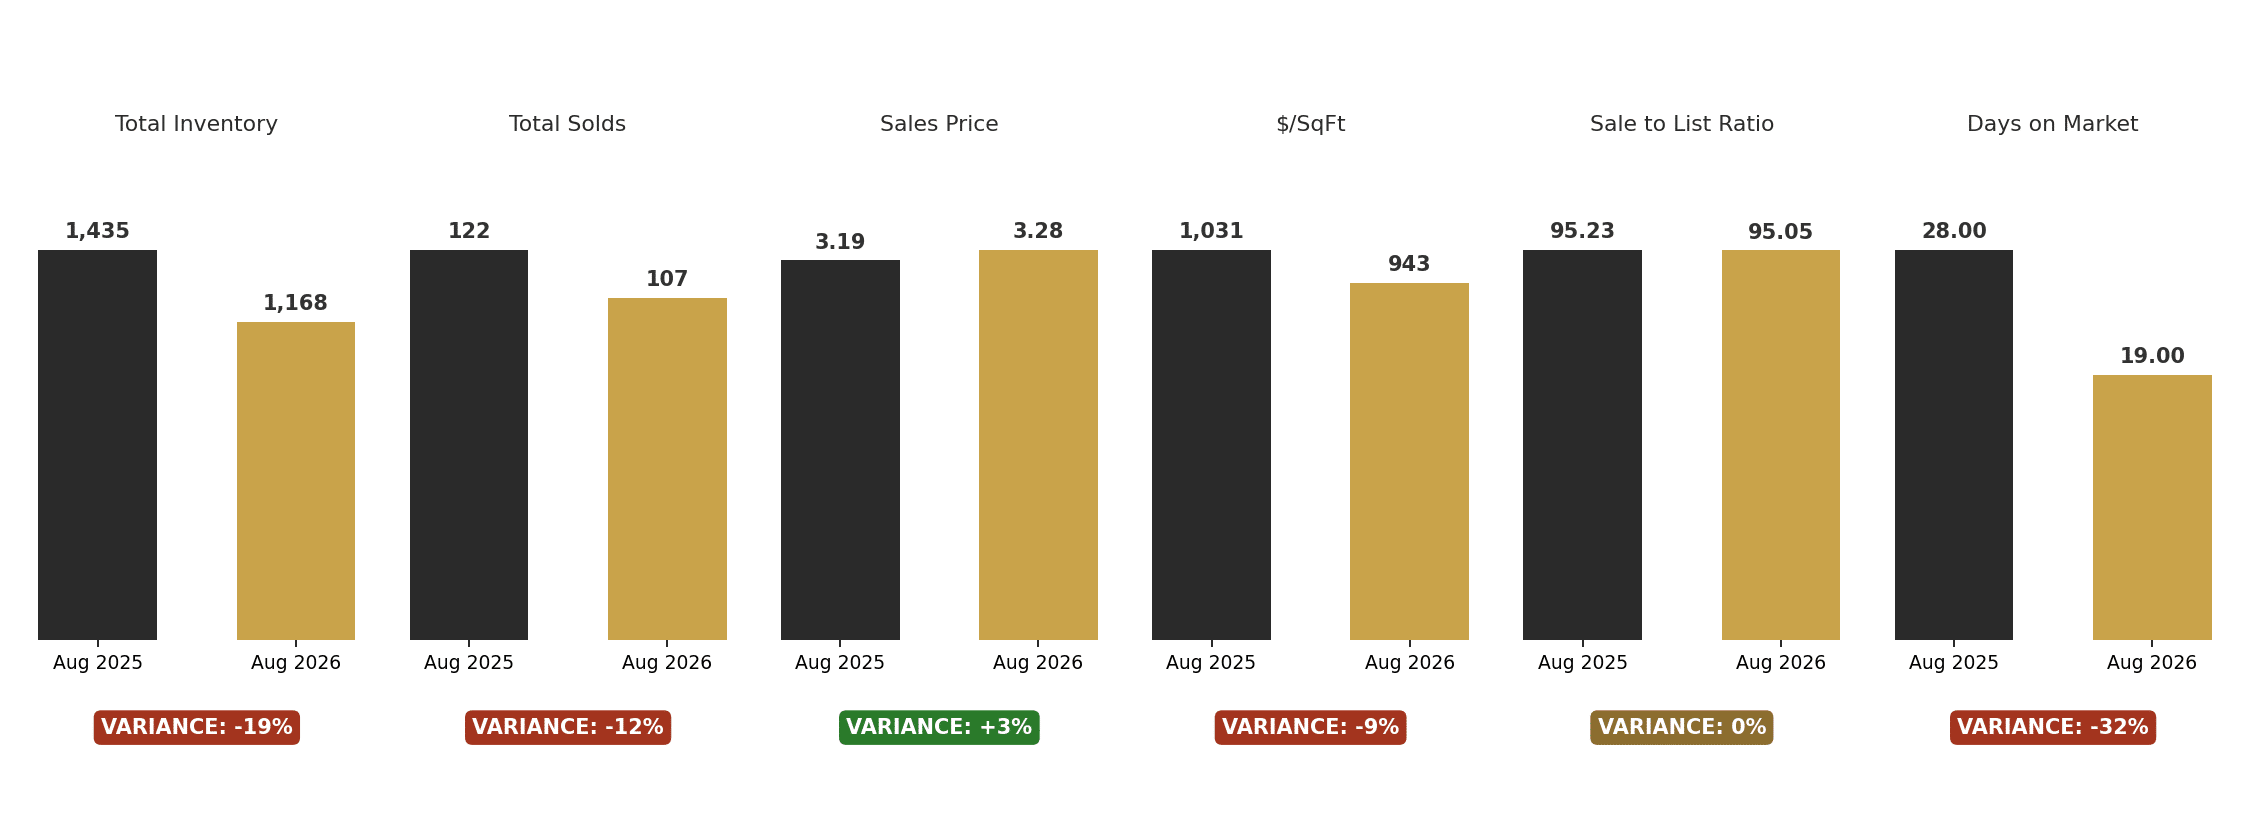
Compared to August 2025, active inventory is down 19 percent and monthly sales are down 12 percent, yet the median sales price still edged up 3 percent to $3,275,000. Price per square foot fell 9 percent, and the median days on market dropped sharply, from 28 days to 19, a 32 percent decline. The share of list price paid held essentially flat. Taken together, fewer homes are trading, but the ones that do are moving faster than a year ago, a market that has become more selective rather than simply weaker.
What This Means for Buyers
Under $3.7 million, buyers should expect real competition. A 13.4 percent sales ratio and a median days on market of 19 mean properly priced homes in this range are not sitting long, and the most active band, $2,700,000 to $2,899,999, is selling at close to 1 in 6. Buyers with financing and paperwork ready are better positioned to act when the right home appears.
Above $3.7 million, and especially at $8 million and up, buyers hold real leverage. With 134 active listings and a single sale in the ultra luxury tier this month, there is room for careful negotiation on price, terms, and timeline that simply does not exist in the tier below.
What This Means for Sellers
Sellers under $3.7 million are working in a market that still rewards accurate pricing, homes sold at a median of 95.05 percent of list and moved in a median of 19 days. Presentation and pricing discipline matter, but demand in this range is genuine.
Sellers above $3.7 million, particularly at $8 million and up, should plan for a longer process. With only 1 sale against 134 active listings in that top tier this month, standing out requires sharp, defensible pricing from the outset and patience through a longer marketing period.
Request the Full September 2026 (August 2026 Data) ILHM Report
The complete analysis and the ILHM Luxury Market Report for Metro Vancouver is available upon request at hiatt.com.
Bruce Hiatt is a Guild Elite Member of the Institute for Luxury Home Marketing, serving buyers and sellers across Metro Vancouver's luxury detached and attached segments.