Vancouver Luxury Attached Market: August 2026 Data
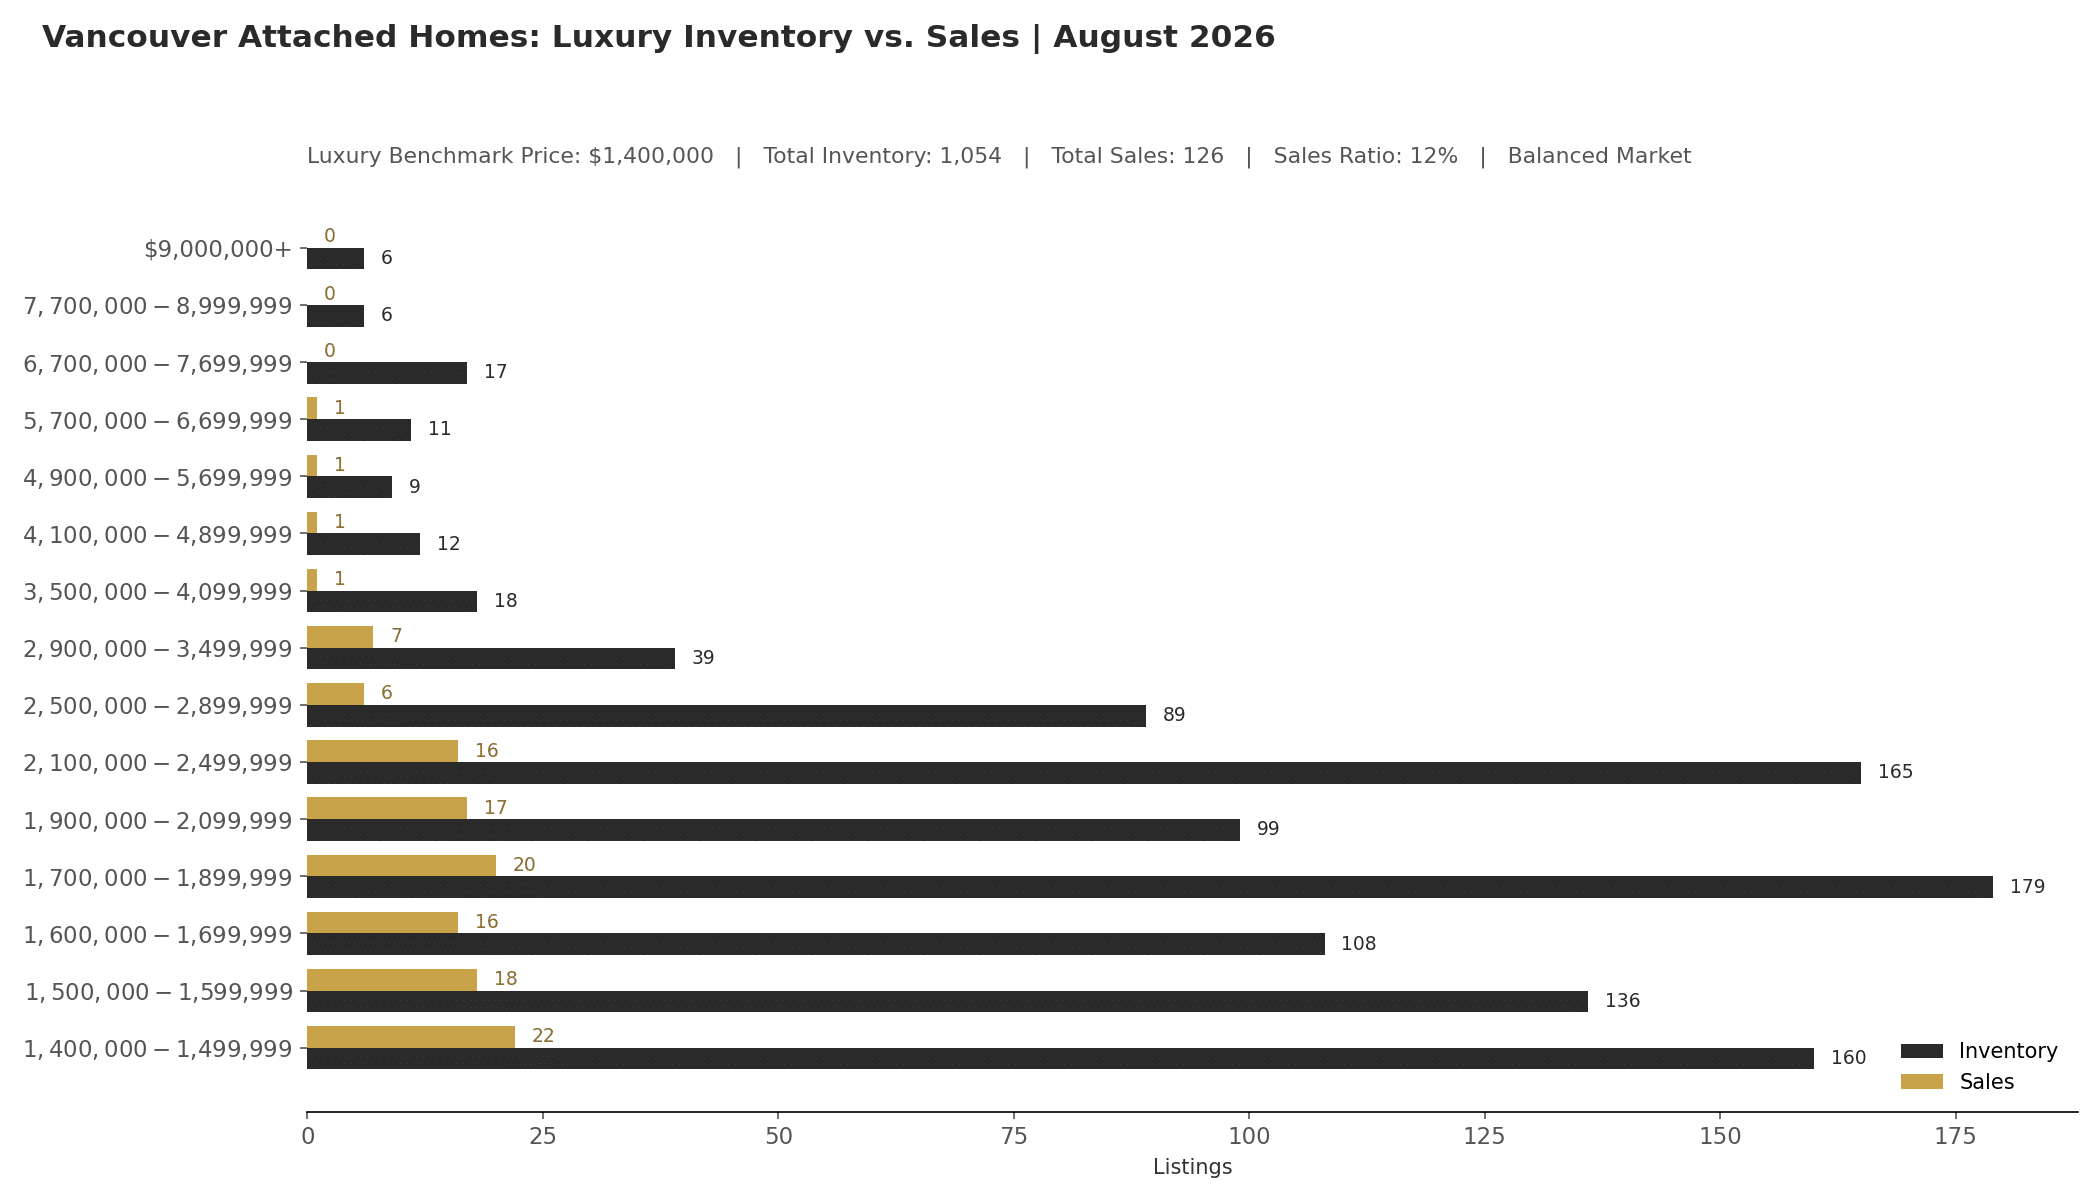
Metro Vancouver's luxury attached market moved into Balanced Market territory in August 2026, with a 12 percent sales ratio against a $1,400,000 benchmark. Total active inventory stood at 1,054 homes against 126 sales for the month. The median sales price was $1,784,000, homes sold at a median of 97.22 percent of list price, and the median days on market fell to 22, down from 33 a year earlier. The activity is broad rather than concentrated at the entry point, real demand runs from $1.4 million up through roughly $4.1 million, with one price band along the way trading even more actively than the benchmark tier itself, and a market that thins out sharply above $4.1 million.
Broad Activity Under $4.1 Million
Homes priced from $1,400,000 to $4,099,999 account for 993 of the month's 1,054 active listings and 123 of its 126 sales, a combined sales ratio of 12.4 percent, close to the overall market rate. Within that range, activity is not simply strongest at the bottom. Every band from $1,400,000 to $2,499,999 posted a sales ratio between roughly 10 and 17 percent, and the single most active band of the month was $2,900,000 to $3,499,999, where 7 of 39 active listings sold, close to an 18 percent ratio, ahead of every band closer to the benchmark. The $2,500,000 to $2,899,999 range was the one soft spot in this tier, at just under 7 percent, before activity picks back up in the band above it.
Above $4.1 Million: Activity Nearly Stops
From $4.1 million up, the market thins out fast. This tier holds 61 active listings but only 3 sales, a sales ratio of 4.9 percent. The 3 sales that did happen were spread between $4.1 million and $6.7 million, and nothing sold above $6.7 million in August, a range covering 29 active listings. Inventory at the top of the attached market is sitting without much competition for it.
Sales Ratio by Square Footage
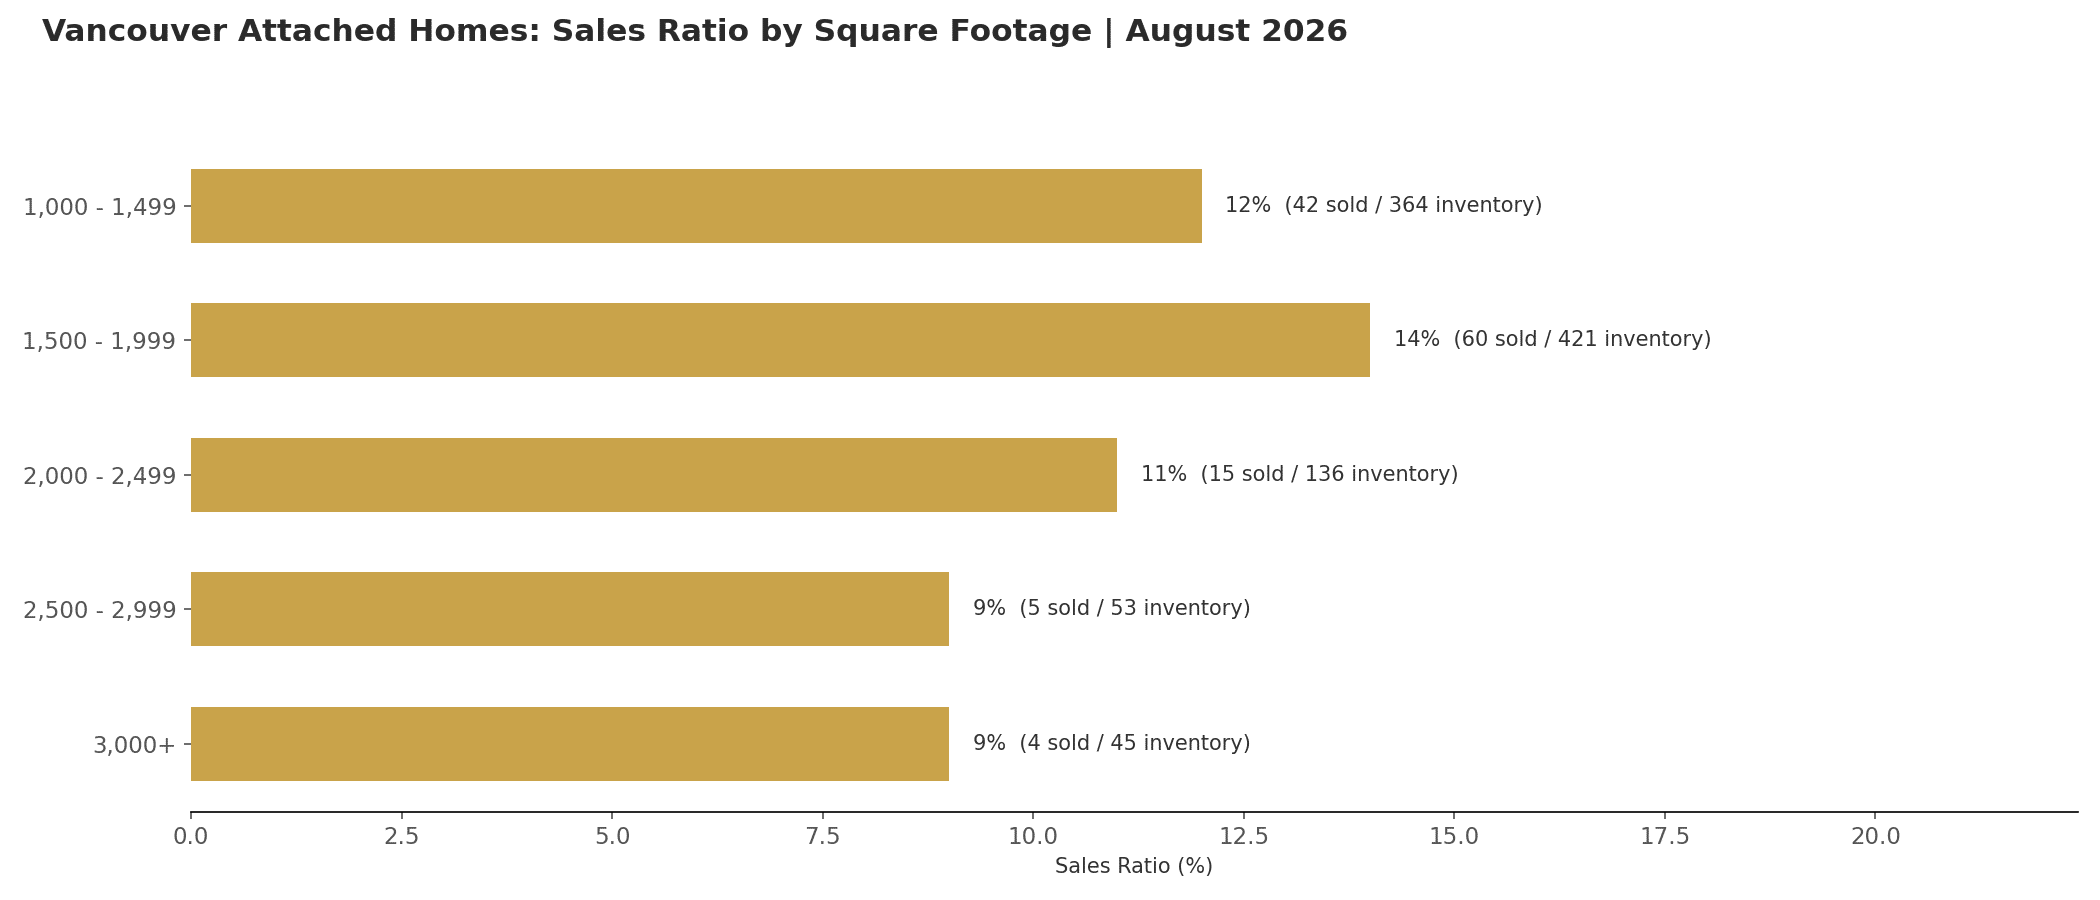
By size, the 1,500 to 1,999 square foot range was the most liquid, with 60 of 421 active listings selling, a 14 percent ratio, at a median price of $1,857,750. The smallest units, under 1,000 square feet, recorded no sales against 35 active listings this month. Larger units eased off gradually, from 11 percent in the 2,000 to 2,499 square foot range down to about 9 percent in both the 2,500 to 2,999 range and the 3,000 and up range, where the median price reached $3,750,000, consistent with the broader slowdown seen above $4.1 million.
13 Month Trend
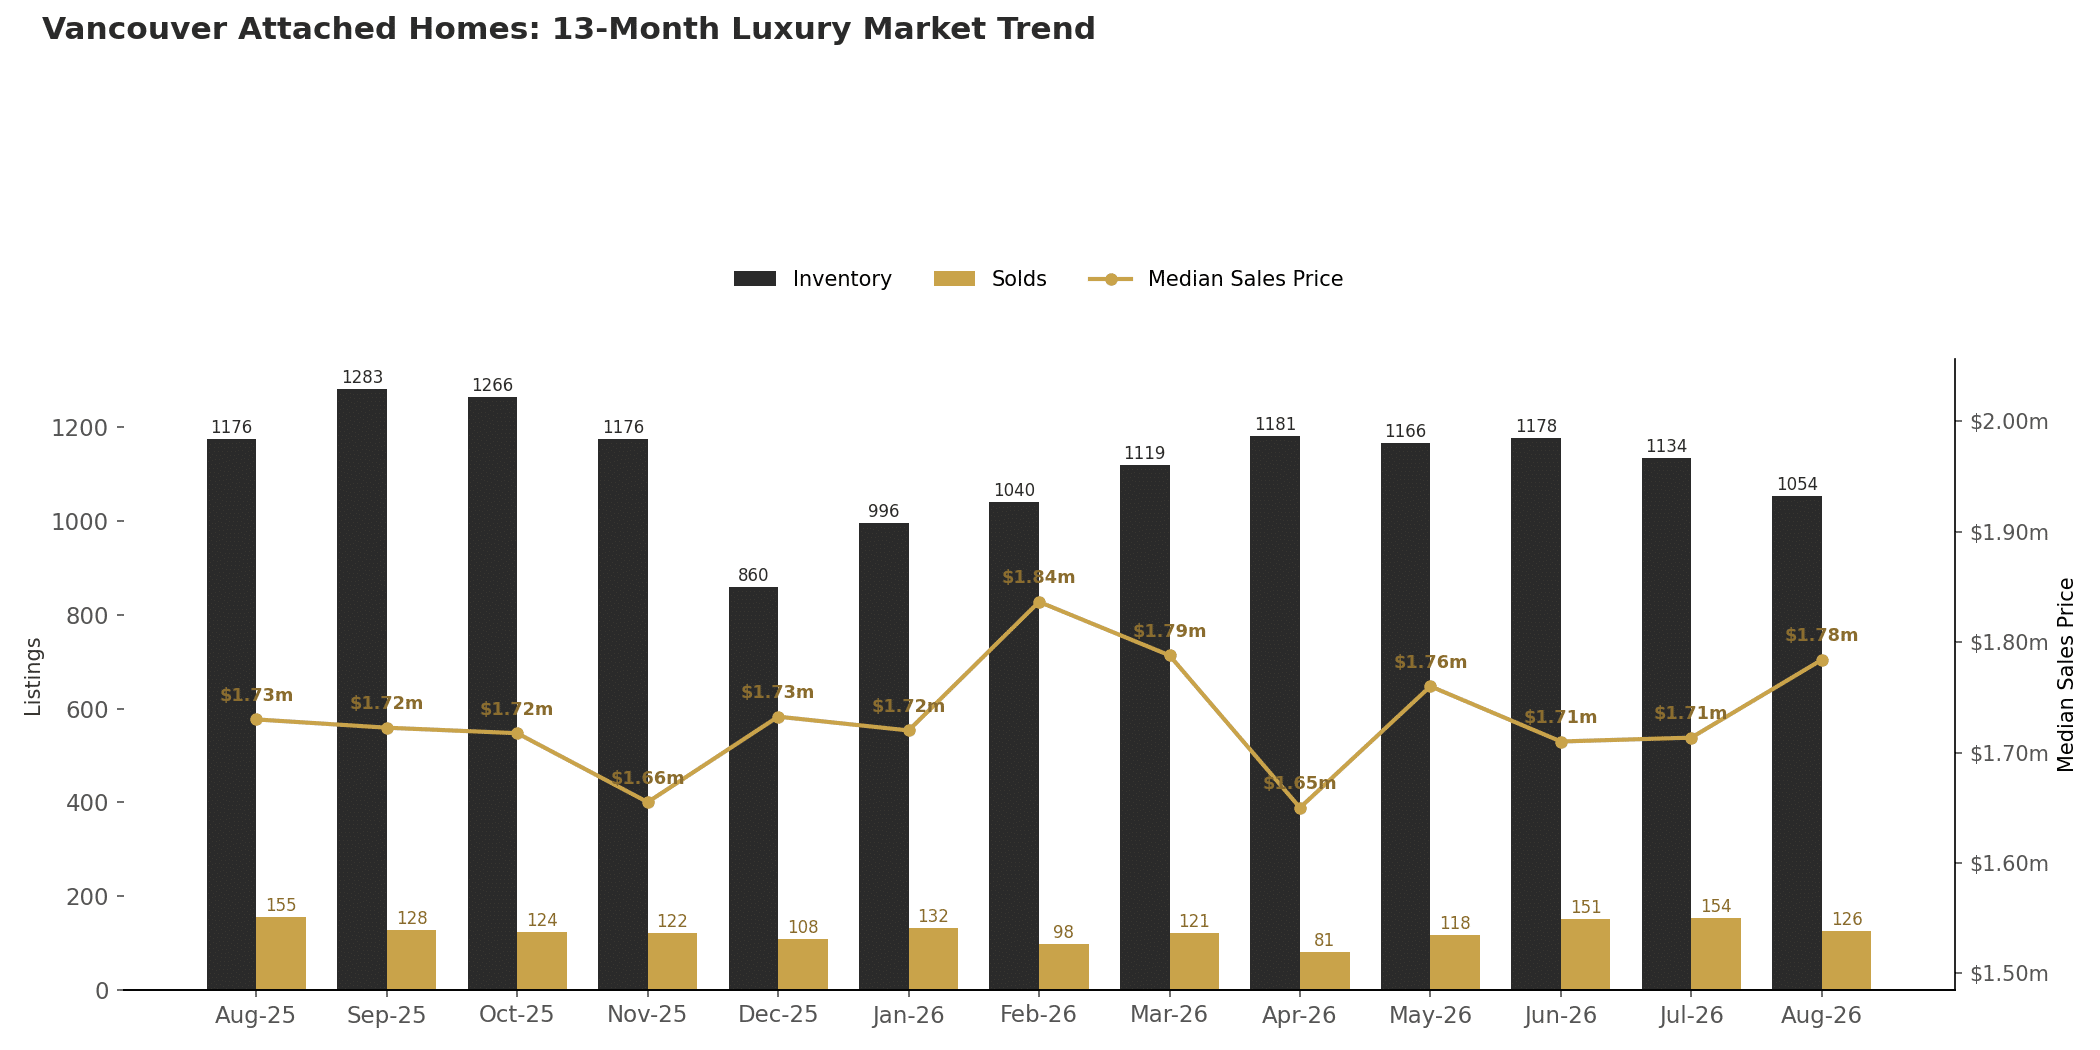
Inventory has swung meaningfully over the past year, peaking at 1,283 active listings in September 2025, falling to a low of 860 in December 2025, then rebuilding through the winter and spring back above 1,100 through much of 2026 before easing to 1,054 in August. Monthly sales followed a similar rhythm, dipping to 81 in April before climbing back to 151 and 154 in June and July, then settling at 126 in August. Median price moved in a comparatively narrow band across the same period, mostly between $1.65 million and $1.84 million, without a clear sustained trend in either direction.
Year over Year Comparison
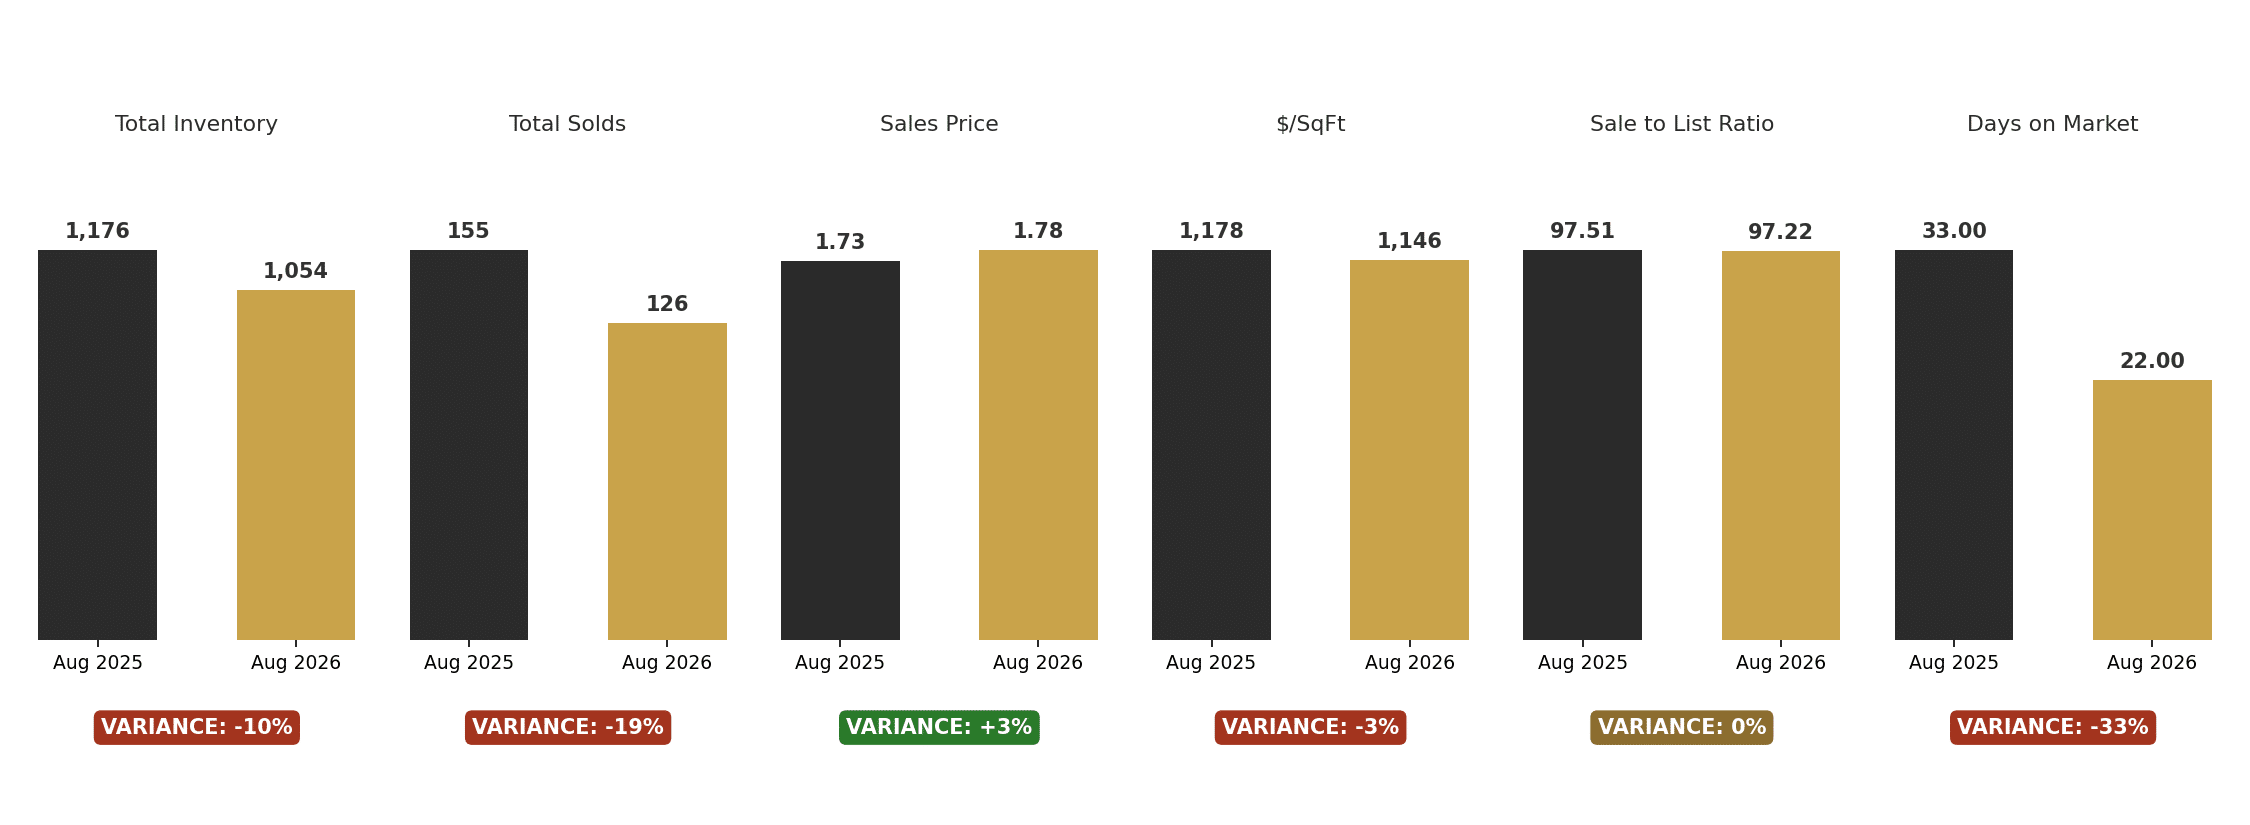
Compared to August 2025, active inventory is down 10 percent and monthly sales are down 19 percent, yet the median sales price still edged up 3 percent to $1,784,000. Price per square foot fell 3 percent, and the median days on market dropped sharply, from 33 days to 22, a 33 percent decline. The share of list price paid held essentially flat. As with the single-family market, fewer attached homes are trading, but the ones that do are moving faster than a year ago.
What This Means for Buyers
Under $4.1 million, buyers should expect broad based competition, not just at the entry price point. The $2,900,000 to $3,499,999 band in particular is trading at close to 1 in 6 this month, ahead of bands closer to the benchmark, so buyers targeting that range should be prepared to move decisively. The $2,500,000 to $2,899,999 range is the one pocket of relative slack in this tier and may offer more room to negotiate.
Above $4.1 million, buyers hold real leverage. With only 3 sales across 61 active listings this month, and nothing selling above $6.7 million, there is meaningful room for negotiation on price and terms.
What This Means for Sellers
Sellers under $4.1 million are working in a market that continues to reward accurate pricing, homes sold at a median of 97.22 percent of list and moved in a median of 22 days. Sellers in the $2,500,000 to $2,899,999 range specifically should expect a somewhat slower process than neighbouring bands and may want extra attention to pricing and presentation.
Sellers above $4.1 million, and especially above $6.7 million where no sales closed in August, should plan for a longer marketing period and pricing that reflects genuinely thin buyer demand at the top of the segment.
Request the Full September 2026 (August 2026 Data) ILHM Report
The complete analysis and the ILHM Luxury Market Report for Metro Vancouver is available upon request at hiatt.com.
Bruce Hiatt is a Guild Elite Member of the Institute for Luxury Home Marketing, serving buyers and sellers across Metro Vancouver's luxury detached and attached segments.