Vancouver Luxury Single-Family Market: September 2026 Data
The lowest median price in 13 months, and why that is not the whole story.
Vancouver's luxury single-family market stayed in Buyer's Market territory in September 2026, with an 8 percent sales ratio against a $2,500,000 benchmark. There were 1,205 homes actively listed and 94 sales for the month, down from 107 sales in August while inventory rose slightly from 1,168. The median sales price came in at $3,092,500, the lowest in the trailing 13 months, and homes sold at a median of 95.39 percent of list price in a median of 30 days.
The lower median deserves a careful read. Sale price per square foot was actually up 3 percent from September 2025, so the decline says more about where buyers were active than about values falling across the board. Nearly two thirds of the month's sales happened below $3.5 million, and that price point is where the market divided this month.
Where Activity Concentrates: Under $3.5 Million
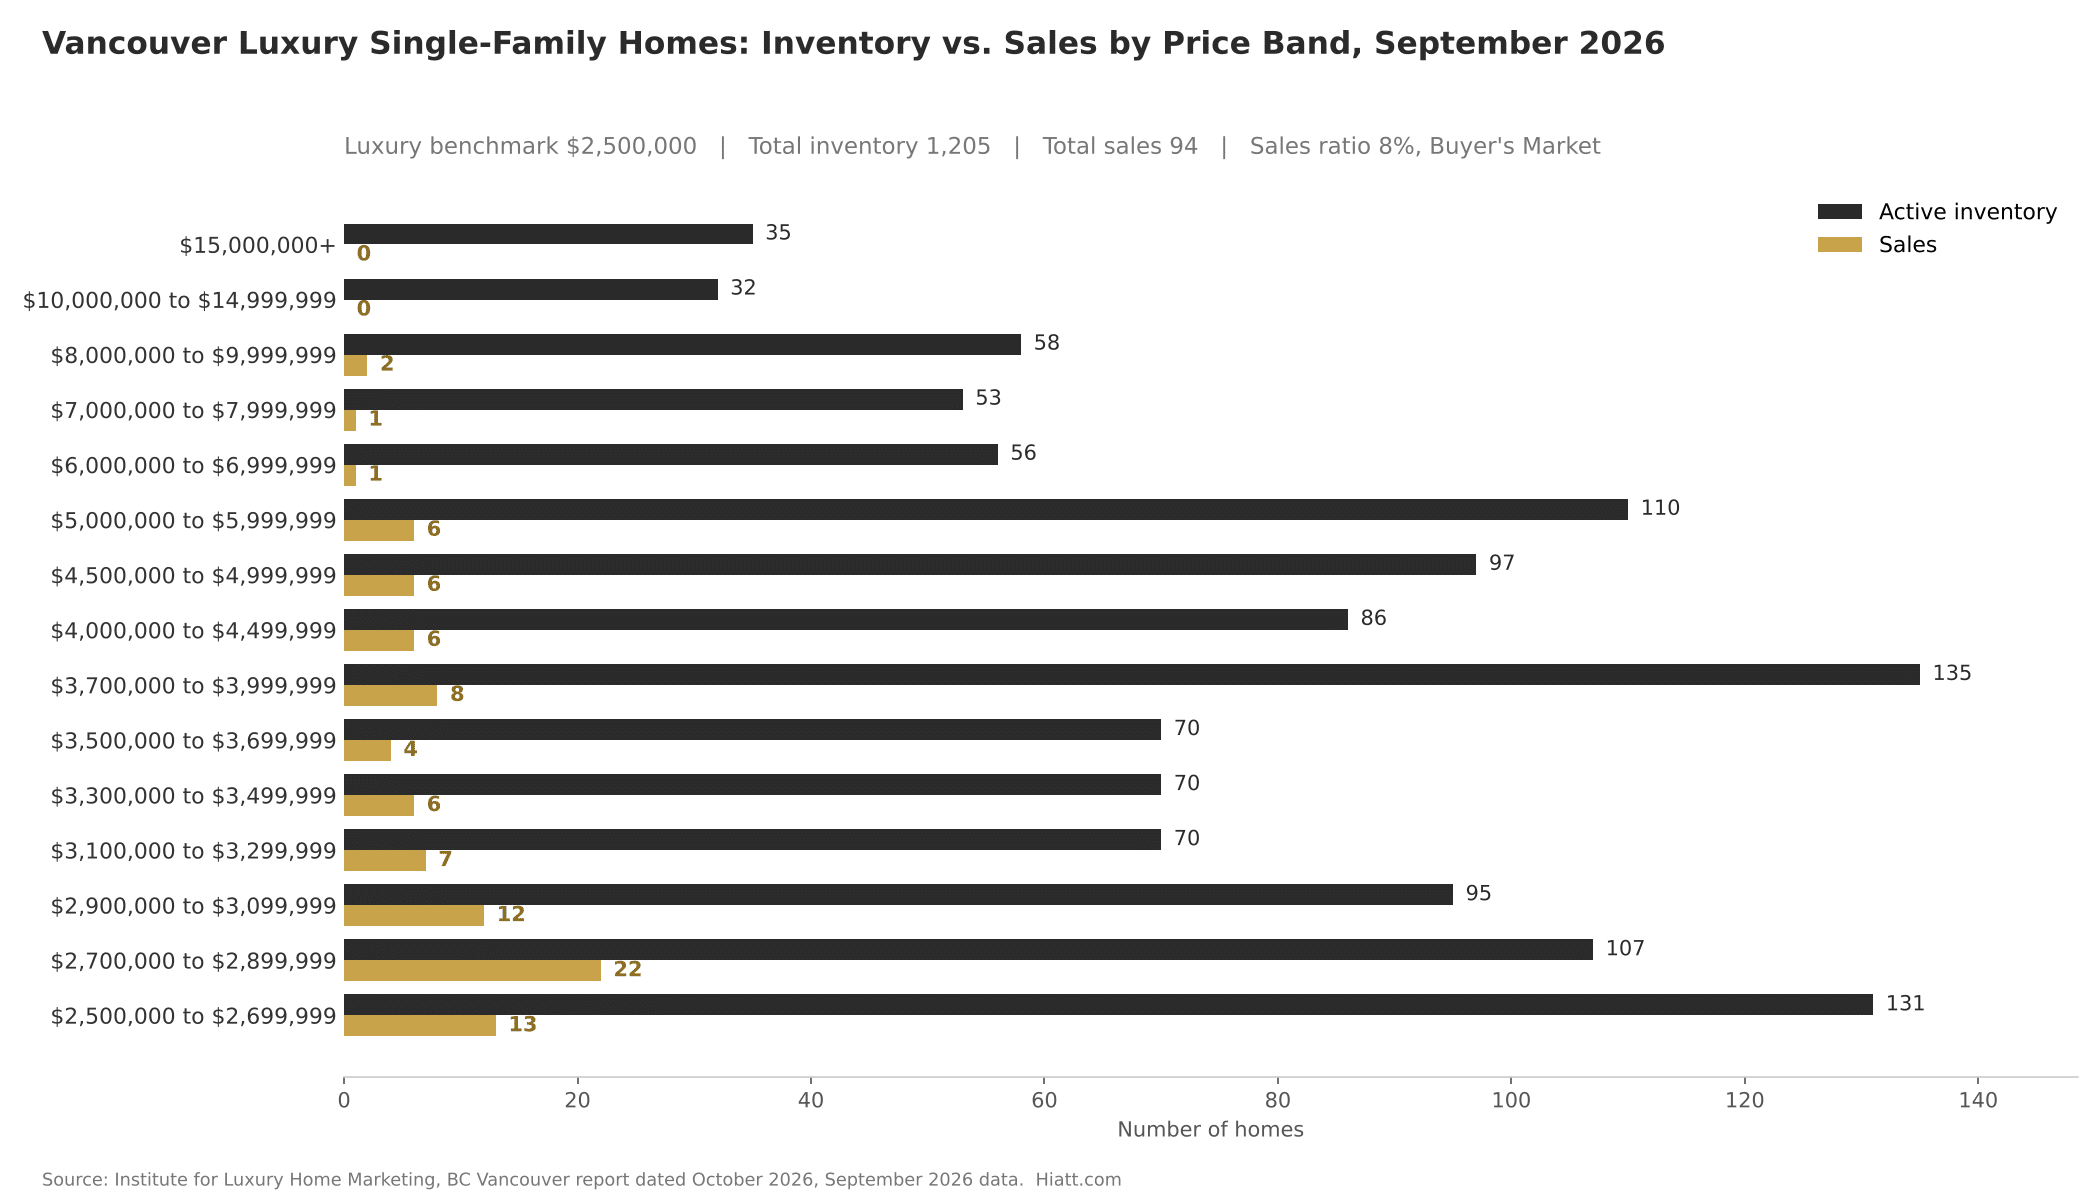
Homes priced from $2,500,000 to $3,499,999 made up 473 of the month's 1,205 active listings and 60 of its 94 sales, a combined sales ratio of 12.7 percent. That is inside the Balanced range, while the market as a whole sits at 8 percent. Every price band in this tier posted a ratio of 8.6 percent or better.
The standout was the $2,700,000 to $2,899,999 price band, where 22 of 107 listings sold, a sales ratio of about 21 percent, right at the line ILHM uses for a Seller's Market. The band just above it, $2,900,000 to $3,099,999, sold 12 of 95 listings, or 12.6 percent. Together those two bands accounted for 34 sales, more than a third of the entire month.
$3.5 Million and Above: A Much Slower Market
From $3.5 million up, 732 homes were listed and 34 sold, a sales ratio of 4.6 percent. No band in this tier reached 7.5 percent. The single largest band on the report, $3,700,000 to $3,999,999, carried 135 listings and only 8 sales.
The pace thins further at the top. From $6 million up there were 234 listings and 4 sales, and above $10 million, 67 homes were listed with no sales at all in September. For owners and buyers in this range, the month confirms what the summer suggested: supply is ample and buyers are taking their time.
Sales Ratio by Square Footage
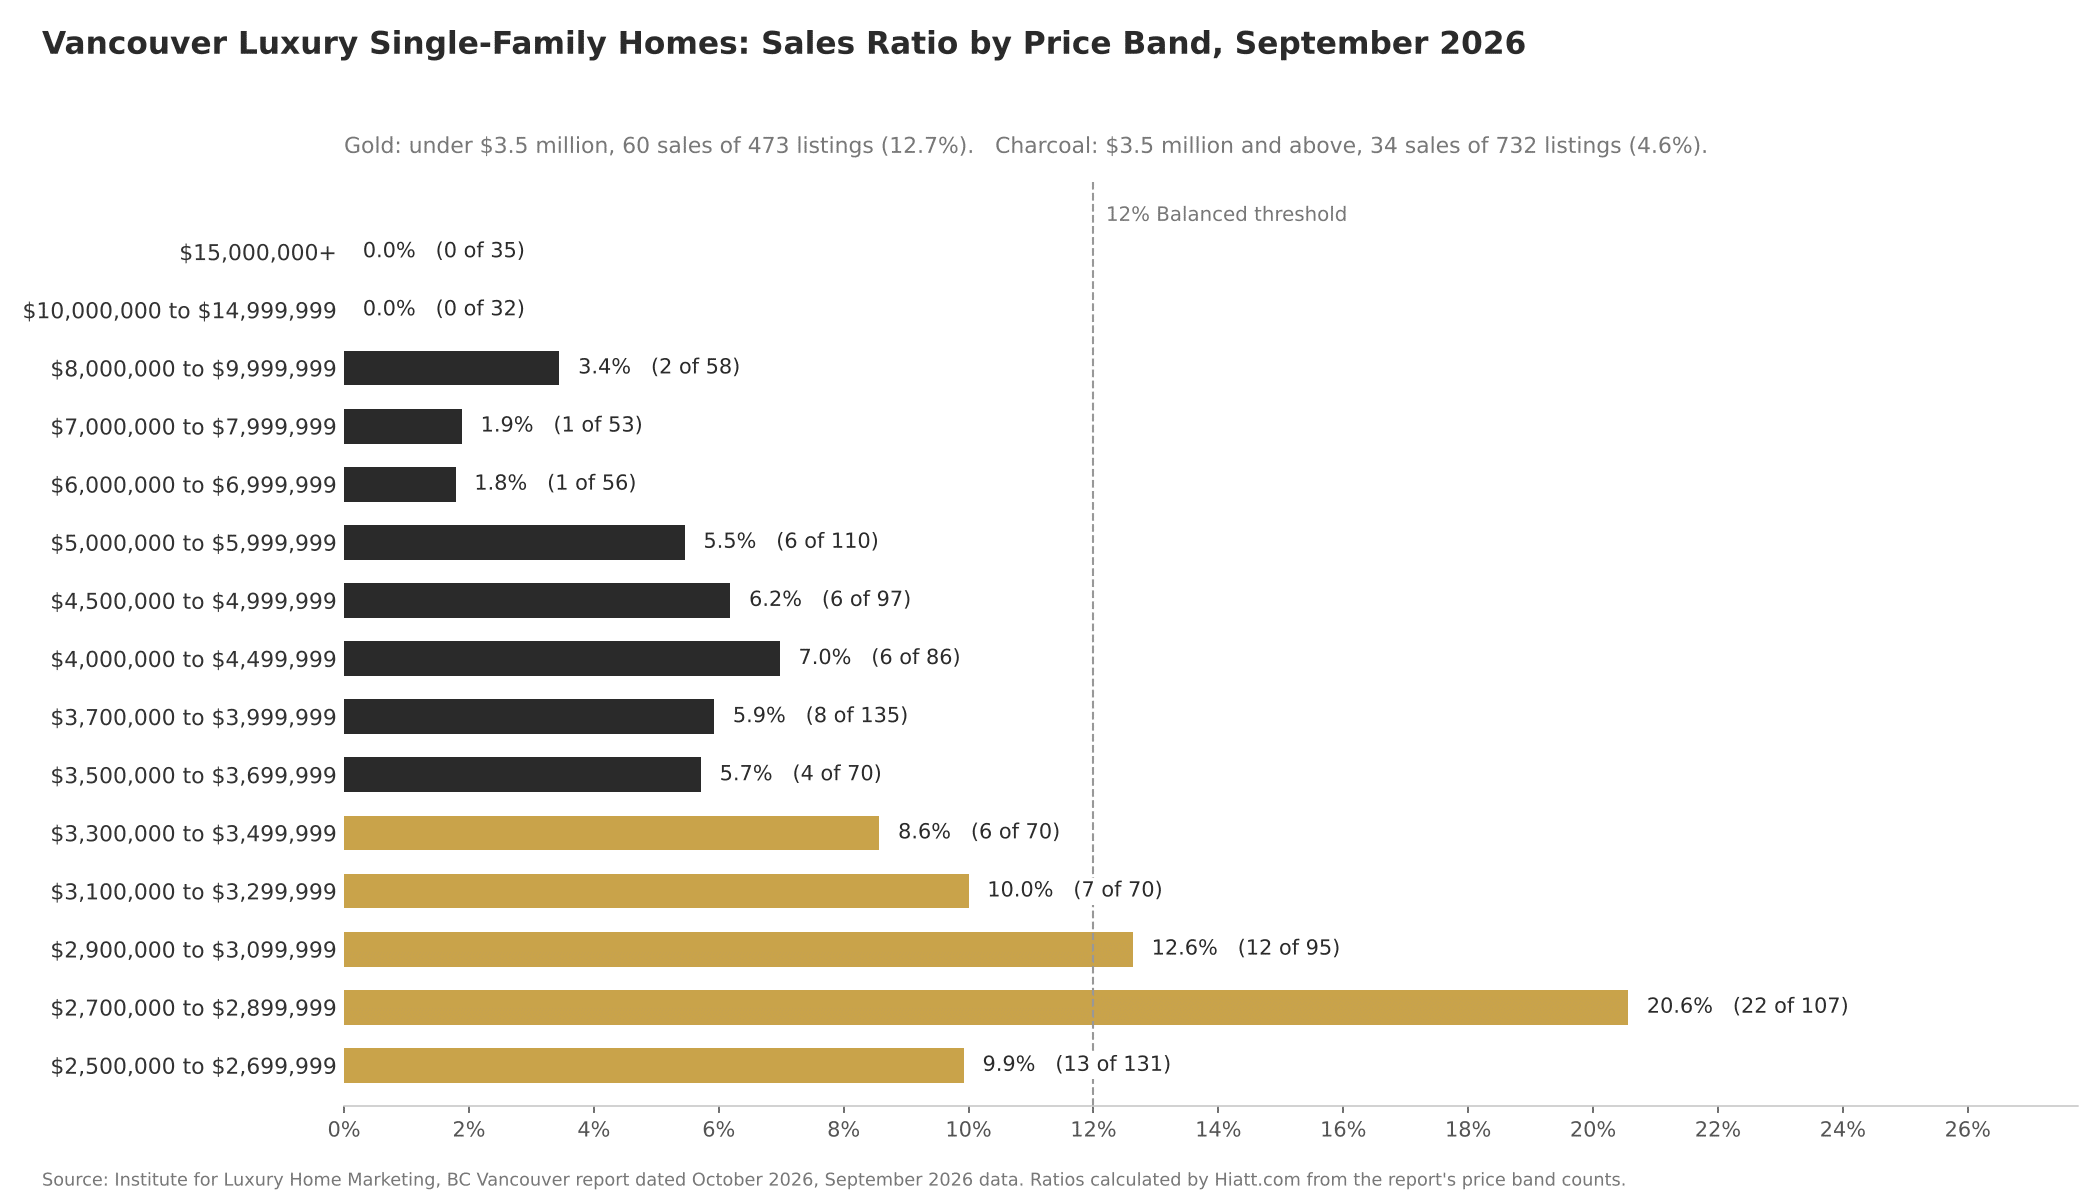
Mid sized homes did most of the work. Homes of 2,000 to 2,999 square feet and 3,000 to 3,999 square feet each sold at a 10 percent ratio, 28 of 281 and 31 of 322 respectively, at medians of $2,890,000 and $2,910,000. Those medians sit right inside the most active price bands, which is consistent with the picture above.
Larger homes moved more slowly. The 4,000 to 4,999 square foot range sold 18 of 249 listings, 7 percent, at a median of $4,087,500. Homes of 5,000 to 5,999 square feet sold at 5 percent, and homes of 6,000 square feet and up sold 6 of 167 listings, 4 percent, at a median of $5,875,000.
13 Month Trend
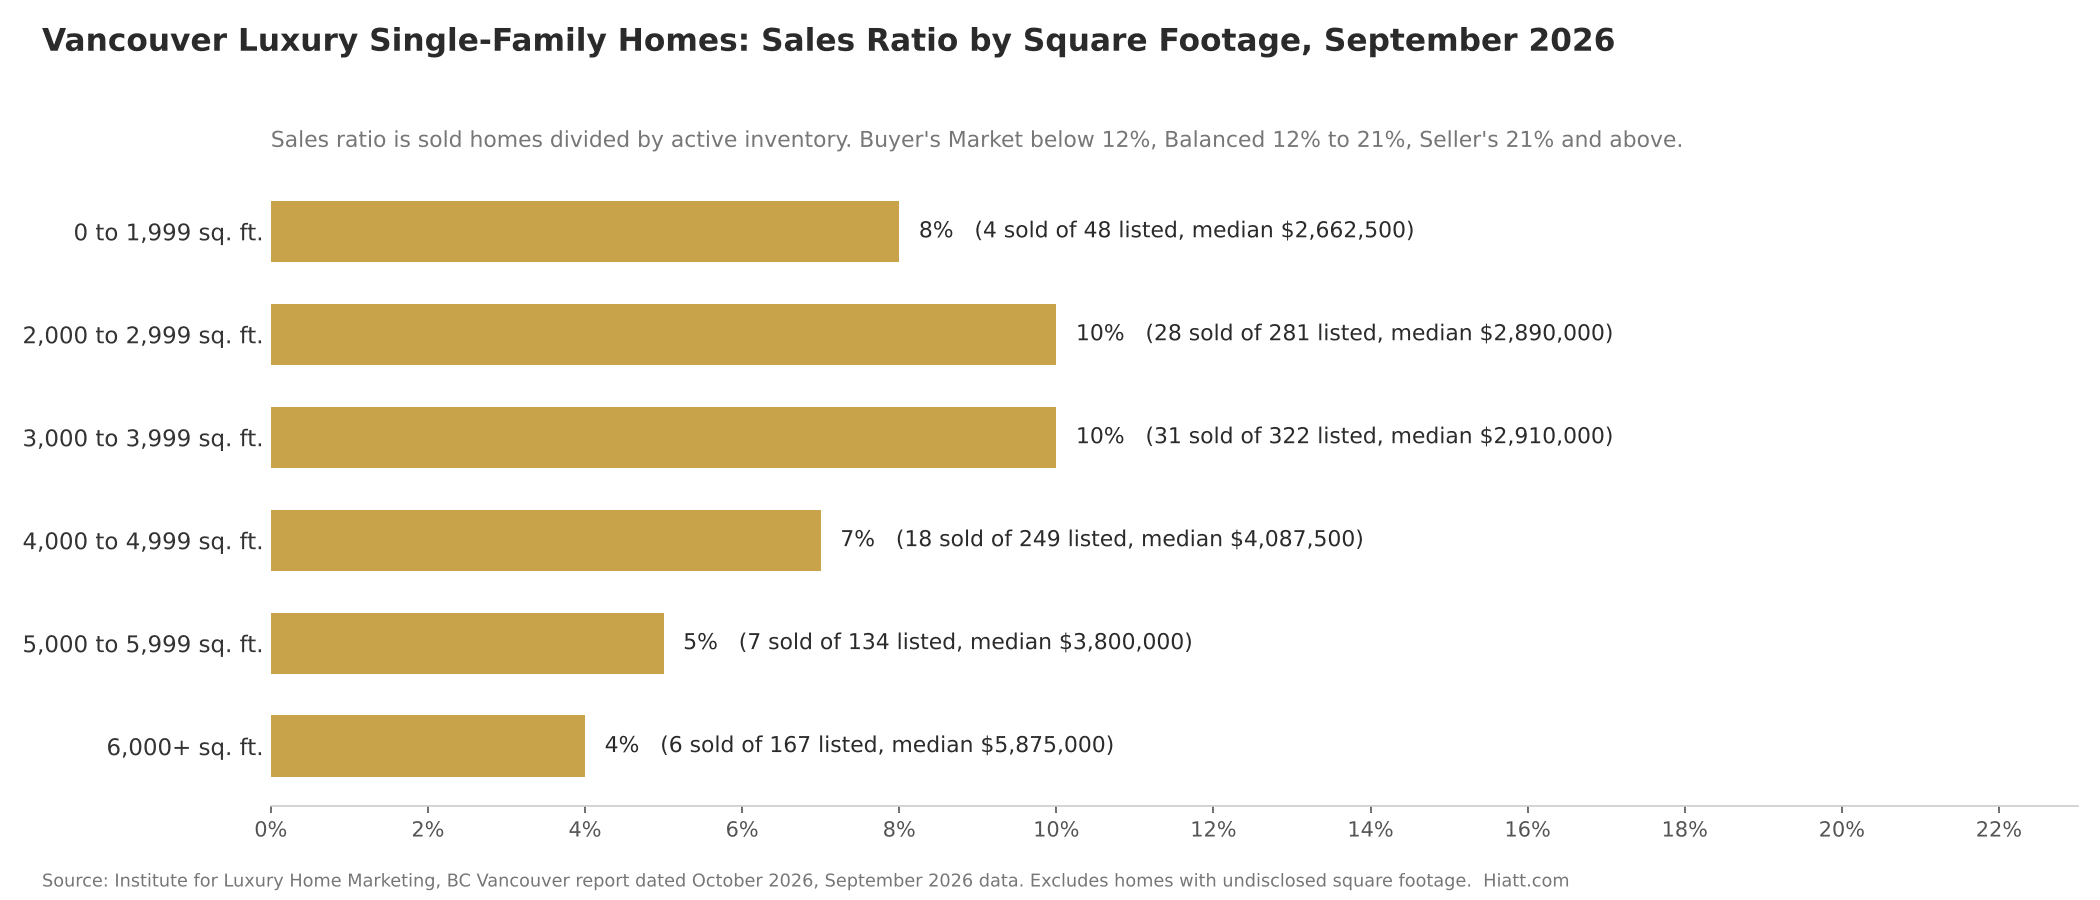
September marks the second straight month of easing after a strong early summer. Sales went from 116 in June to 130 in July, then 107 in August and 94 in September. Even so, September's 94 sales were more than any single month from November 2025 through May 2026. Inventory, which stood at 1,546 a year ago, has held between 1,168 and 1,299 since April.
The median price line tells the same story of mix. It peaked at $3,505,000 in June and has stepped down each month since, to $3,310,000 in July, $3,275,000 in August and $3,092,500 in September, as sales leaned further toward the lower price bands.
Year over Year Comparison
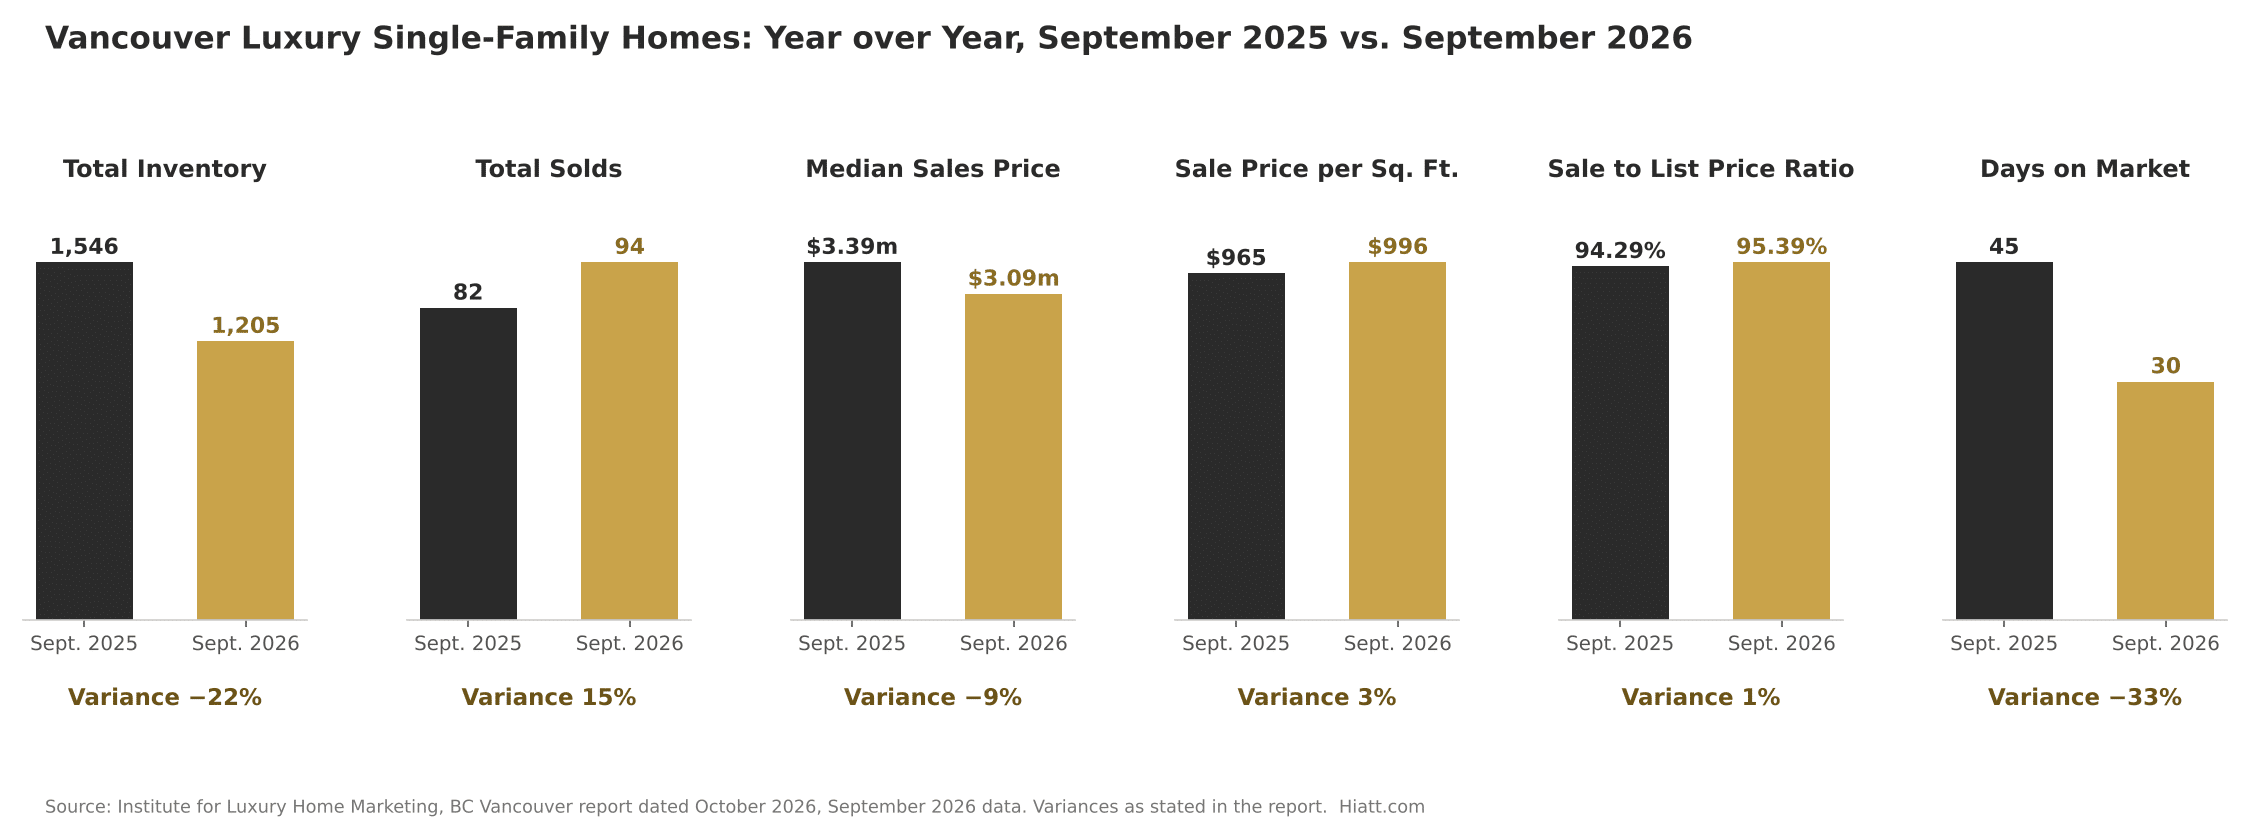
Against September 2025, active inventory is down 22 percent, from 1,546 to 1,205, and sales are up 15 percent, from 82 to 94. Homes sold faster, with median days on market falling from 45 to 30, and buyers paid a slightly higher share of the asking price, 95.39 percent compared with 94.29 percent. Sale price per square foot rose 3 percent to $996.
The median sales price, by contrast, is down 9 percent, from $3.39 million to $3.09 million. Read alongside the other five measures, that is a market with less supply and quicker sales than a year ago, where more of the activity is happening at the lower end of the luxury range.
What This Means for Buyers
Between $2.7 million and $3.1 million, buyers are competing with each other, and the rest of the tier under $3.5 million is moving at a steady pace. Well priced homes in that range are not sitting long, so it pays to have financing arranged and a clear sense of value before the right property comes up.
From $3.5 million up, the balance favours the buyer. With a 4.6 percent sales ratio and a deep selection of homes between $3.7 million and $6 million, there is room to compare carefully and negotiate on price, terms and timing. A conversation with Bruce Hiatt about recent sales in the specific neighbourhood is the best way to know where that room is.
What This Means for Sellers
Sellers under $3.5 million are in a market that rewards accurate pricing. Homes are selling at a median of 95.39 percent of list in about a month, and the busiest price bands are moving at a Balanced or better pace.
Sellers above $3.5 million should plan for a longer campaign and price against the competition, not against last spring. When 135 homes are listed between $3.7 million and $4 million and 8 sell in a month, condition, presentation and a defensible list price decide which homes get the showings.
Request the Full October 2026 (September 2026 Data) ILHM Report
The complete analysis and the ILHM Luxury Market Report for Metro Vancouver is available upon request at hiatt.com.
Bruce Hiatt is a Guild Elite Member of the Institute for Luxury Home Marketing, serving buyers and sellers across Metro Vancouver's luxury detached and attached segments.