Vancouver Luxury Real Estate Market Report — May 2026
What the Gap Between Asking and Selling Price Tells Sellers Right Now
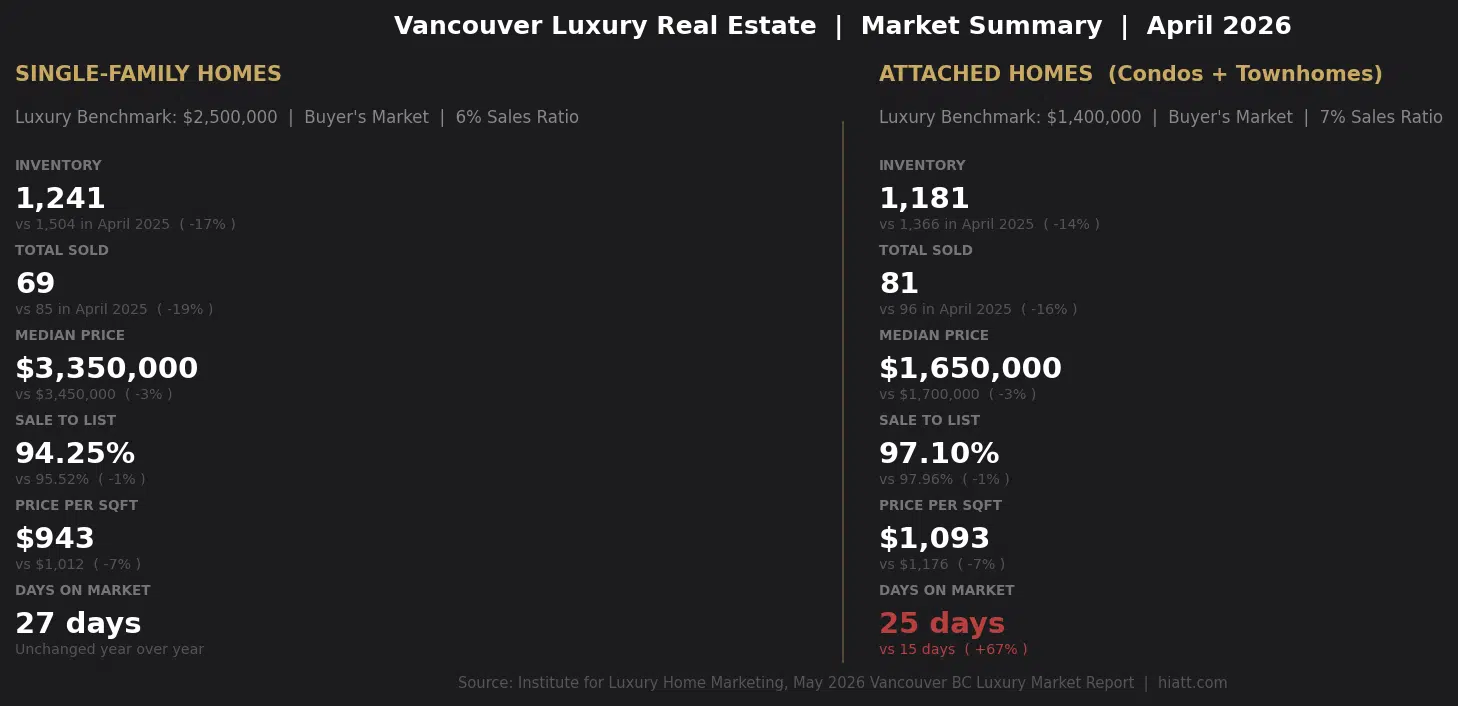
Vancouver’s luxury single-family market closed April 2026 with a median sale-to-list price ratio of 94.25 percent. On a home listed at $3,500,000, that ratio translates to a closing price of approximately $3,290,000, a gap of roughly $210,000 between what a seller asked and what a buyer paid. A year ago, that same ratio was 95.52 percent. The gap has widened, and sellers who are pricing based on 2025 assumptions are absorbing that difference.
The May 2026 Institute for Luxury Home Marketing report covers both segments of Vancouver’s luxury market in detail. Combined, there are more than 2,400 active luxury listings in Vancouver, with fewer than 150 homes sold in April across both categories. That is a market defined by buyer choice, and the numbers that matter most are the ones telling sellers exactly where demand actually lives.
Both market segments carry a Buyer’s Market designation for April 2026. A sales ratio below 12 percent defines a Buyer’s Market. Single-family came in at 6 percent. Attached came in at 7 percent. Within that broad picture, specific price bands tell a different story, and knowing which ones are worth understanding if you are buying or selling.
Vancouver Luxury Market Summary | April 2026 | Data: Institute for Luxury Home Marketing
Single-Family Homes: Inventory vs. Sales by Price Band | April 2026 | Source: ILHM
The inventory-to-sales picture above is the clearest illustration of where demand is concentrated. The most active price band for single-family homes is $3,100,000 to $3,299,999, where the sales ratio reaches 12 percent, the boundary between a Buyer’s Market and a Balanced Market. That band has 85 listings and 10 sales. Above $7,000,000, sales have effectively stopped: 54 listings in the $7M to $8M range sold zero homes in April, and the $10M plus segment logged zero sales across 85 combined listings.
For sellers in the $3.1M to $3.3M range, the data is relatively encouraging. For sellers above $5M, the data requires a candid conversation about buyer demand, timeline, and pricing strategy.
Single-Family Homes by Square Footage — April 2026
Square Footage
Median Sold Price
Median Beds
Median Baths
Sold
Inventory
Sales Ratio
Under 2,000
$2,900,000
2
3
1
64
2%
2,000 to 2,999
$2,998,000
4
3
15
300
5%
3,000 to 3,999
$3,190,000
4
4
26
318
8%
4,000 to 4,999
$3,450,000
6
6
18
244
7%
5,000 to 5,999
$4,463,500
5
6
4
131
3%
6,000 and above
$5,600,000
5
6
5
183
3%
Bold row indicates the most active size segment. Square footage data excludes listings where size is not disclosed.Single-Family Homes: 13-Month Luxury Market Trend | April 2025 through April 2026 | Source: ILHM
The 13-month trend shows the median single-family price has held within a relatively narrow range of $3,185,000 to $3,494,900 over the past year. That band of stability is notable given the volume declines on both sides. Inventory peaked at 1,574 in May 2025 and has trended down since. Sales peaked at 122 in August 2025 and have declined since. Both sides pulling back at similar rates has kept pricing relatively contained, even as individual months show variation.
The attached market’s most significant signal is the days-on-market number. Days on market for luxury attached homes, condos and townhomes, rose from 15 days in April 2025 to 25 days in April 2026. That is a 67 percent increase year over year. A property that would have had a signed contract within two weeks a year ago is now sitting on the market for nearly four weeks. Time on market is not a neutral metric in luxury real estate. Every additional week raises questions in buyers’ minds and creates room for negotiation that would not have existed in a faster market.
Attached Homes: Inventory vs. Sales by Price Band | April 2026 | Source: ILHM
The most notable feature of the attached market data is the divergence at the ultra-premium end. The $7,700,000 to $8,999,999 price band carries a 33 percent sales ratio, which places it in Seller’s Market territory, while the broader attached market sits at 7 percent. Two properties in a category of only three listings sold in April. This is a thin data set, but it signals that ultra-premium attached product is commanding genuine buyer urgency while the broader condo market faces far more patient buyers.
The most transaction volume is concentrated in the entry-level luxury range. The $1,400,000 to $1,499,999 band saw 20 sales from 182 listings. The $1,700,000 to $1,899,999 band saw 14 sales from 202 listings. Above $2,500,000 in the attached segment, sales velocity drops sharply.
Attached Homes by Square Footage — April 2026
Square Footage
Median Sold Price
Median Beds
Median Baths
Sold
Inventory
Sales Ratio
Under 1,000
Not Available
N/A
N/A
0
47
0%
1,000 to 1,499
$1,555,000
3
3
33
431
8%
1,500 to 1,999
$1,685,000
3
4
32
468
7%
2,000 to 2,499
$2,038,250
3
4
10
147
7%
2,500 to 2,999
$2,850,000
4
4
5
46
11%
3,000 and above
$8,200,000
3
4
1
42
2%
Bold row indicates the most active size segment. Square footage data excludes listings where size is not disclosed.Attached Homes: 13-Month Luxury Market Trend | April 2025 through April 2026 | Source: ILHM
The attached 13-month trend shows the most stability in pricing, with median values ranging between $1,650,000 and $1,836,500 over the full period. Sales volume, however, has declined markedly. The attached segment recorded 175 sales in June 2025 and only 81 in April 2026. The steep drop in sales alongside the sharp rise in days on market represents the clearest softening signal in either segment over this period.
Year-Over-Year Summary — April 2025 vs. April 2026
Year-Over-Year Comparison: April 2025 vs. April 2026 | Both Segments | Source: ILHM
The year-over-year data confirms that both segments moved in the same direction across every meaningful indicator except days on market for single-family homes, which held steady at 27 days. Price per square foot declined 7 percent in both segments, the sharpest uniform move across the board. The sale-to-list ratio decline is modest in percentage terms but significant in dollar terms at higher price points. At $5,000,000, a one-point drop in the sale-to-list ratio represents $50,000.
What This Data Means for Buyers
April 2026 is a genuinely good time to be a luxury buyer in Vancouver. Both market segments are firmly in Buyer’s Market territory. Inventory in both categories, over 1,200 single-family homes and over 1,180 attached properties priced at the luxury threshold, gives you genuine choice across neighbourhoods and building types. Sellers are negotiating, with single-family homes closing at 94.25 percent of list price on average. Days on market give you time to be deliberate rather than reactive.
The risk in a Buyer’s Market is assuming the window stays open indefinitely. Inventory in both segments has actually declined year over year, down 17 percent for single-family and 14 percent for attached. If buyer activity accelerates ahead of a Bank of Canada rate decision or a seasonal shift, the transition from Buyer’s Market to Balanced Market can happen faster than most buyers anticipate. Being prepared to act with clarity, rather than waiting for a precise market bottom, is the more defensible position.
What This Data Means for Sellers
Pricing accurately and presenting exceptionally are not optional in this market. They are the entire strategy. With 1,241 single-family listings competing for 69 buyers and 1,181 attached listings competing for 81 buyers, properties that are overpriced or under-presented do not sell. They accumulate days on market, attract lower offers, and ultimately close at a greater discount than a correctly priced property would have achieved on day one.
The most active single-family demand sits between $3,100,000 and $3,299,999. For attached homes, the entry-level luxury range absorbs the most transactions. Sellers who understand which price band actually has buyers, and price to compete within it rather than above it, are the ones closing in this market. The sale-to-list ratio will keep falling for properties that resist that adjustment.
A Note on the Data
The figures in this report are drawn directly from the Institute for Luxury Home Marketing’s May 2026 Vancouver British Columbia Luxury Market Report, covering April 2026 sales and inventory data. The ILHM sets the luxury benchmark prices and sales ratio thresholds used throughout this analysis. As an Elite member of the Institute for Luxury Home Marketing, I receive this report monthly and publish a market analysis based on its findings each month. Market data reflects conditions as reported for April 2026. Individual neighbourhood and property type results vary from market-wide medians.
Let’s Talk About Your Position in This Market
Whether you are weighing a sale, evaluating a purchase, or simply trying to understand what this data means for a property you already own, I am happy to have that conversation. The numbers in a market report tell the broad story. The neighbourhood-level detail, the specific building dynamics, and the current buyer activity in your price range are the conversation that follows.
Contact Bruce Hiatt directly and I personally respond to every inquiry.
Data source: Institute for Luxury Home Marketing, May 2026 Vancouver British Columbia Luxury Market Report. Market data covers April 2026.